System Monitoring
The System Monitoring area of the administration section of the web interface provides facilities for monitoring various aspects of the CatDV Server installation
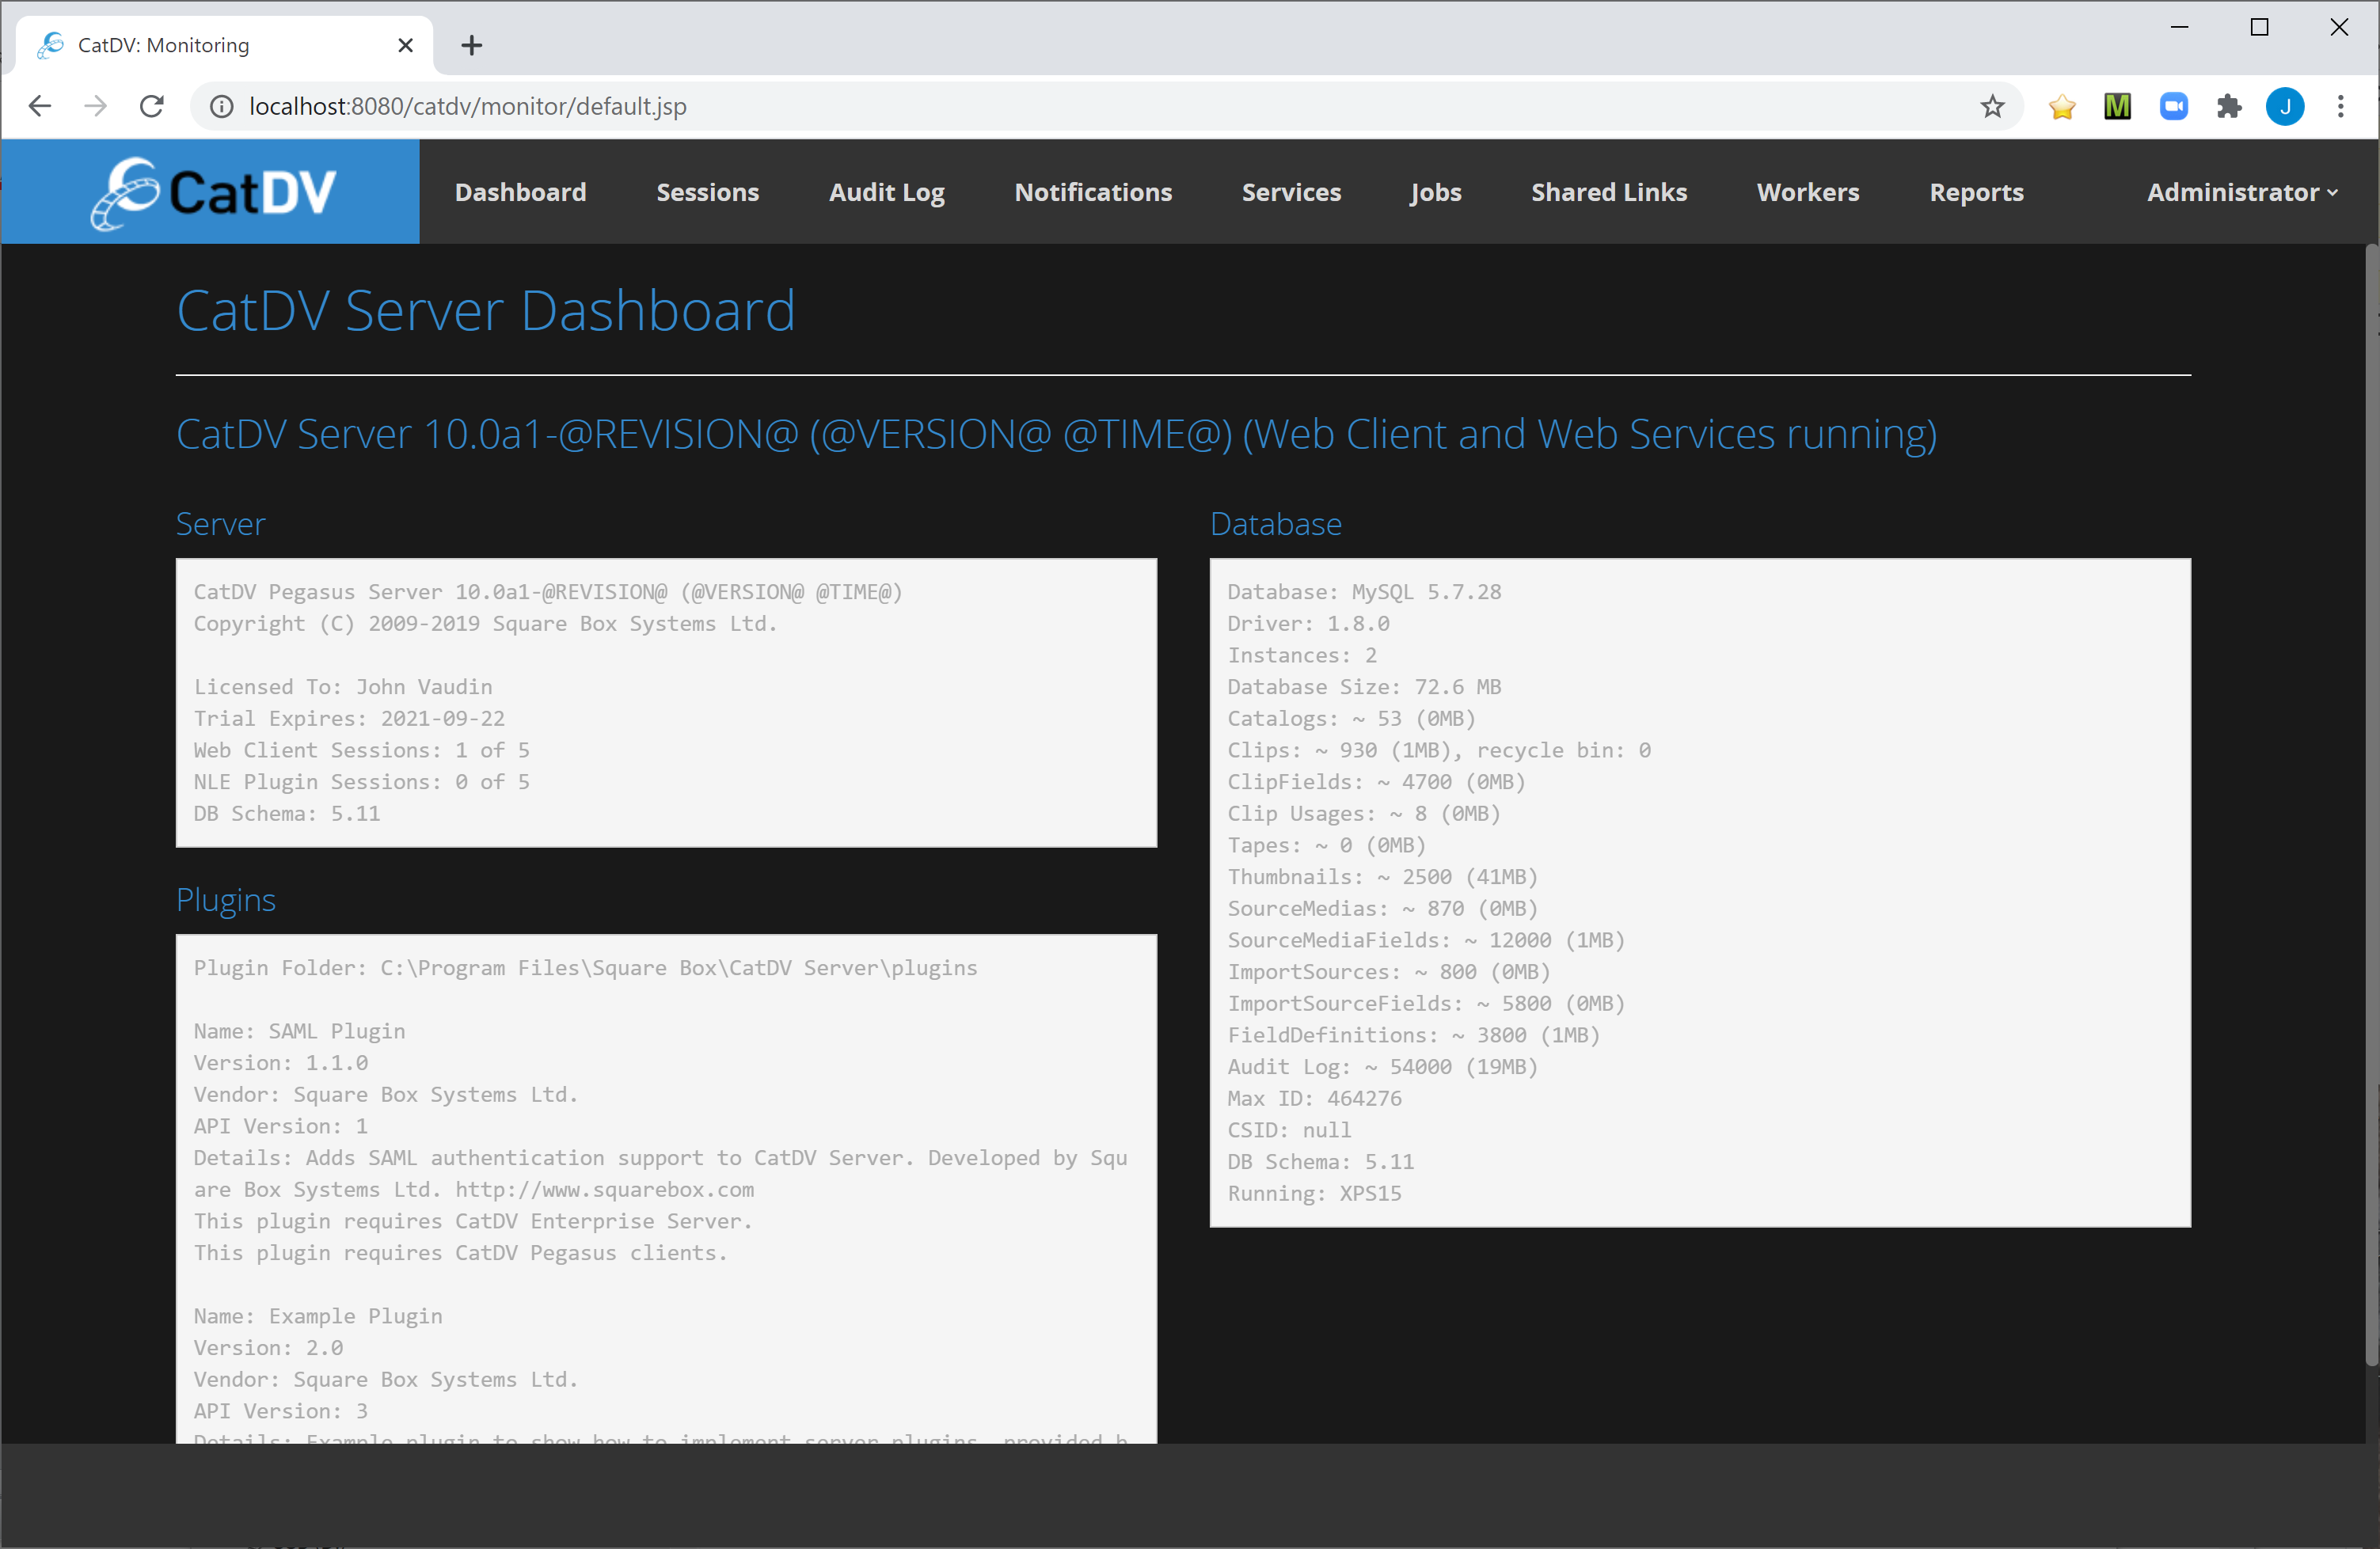
Dashboard
The Dashboard displays an overview of the running system – displaying version information, installed plugins and statistics about the CatDV database.
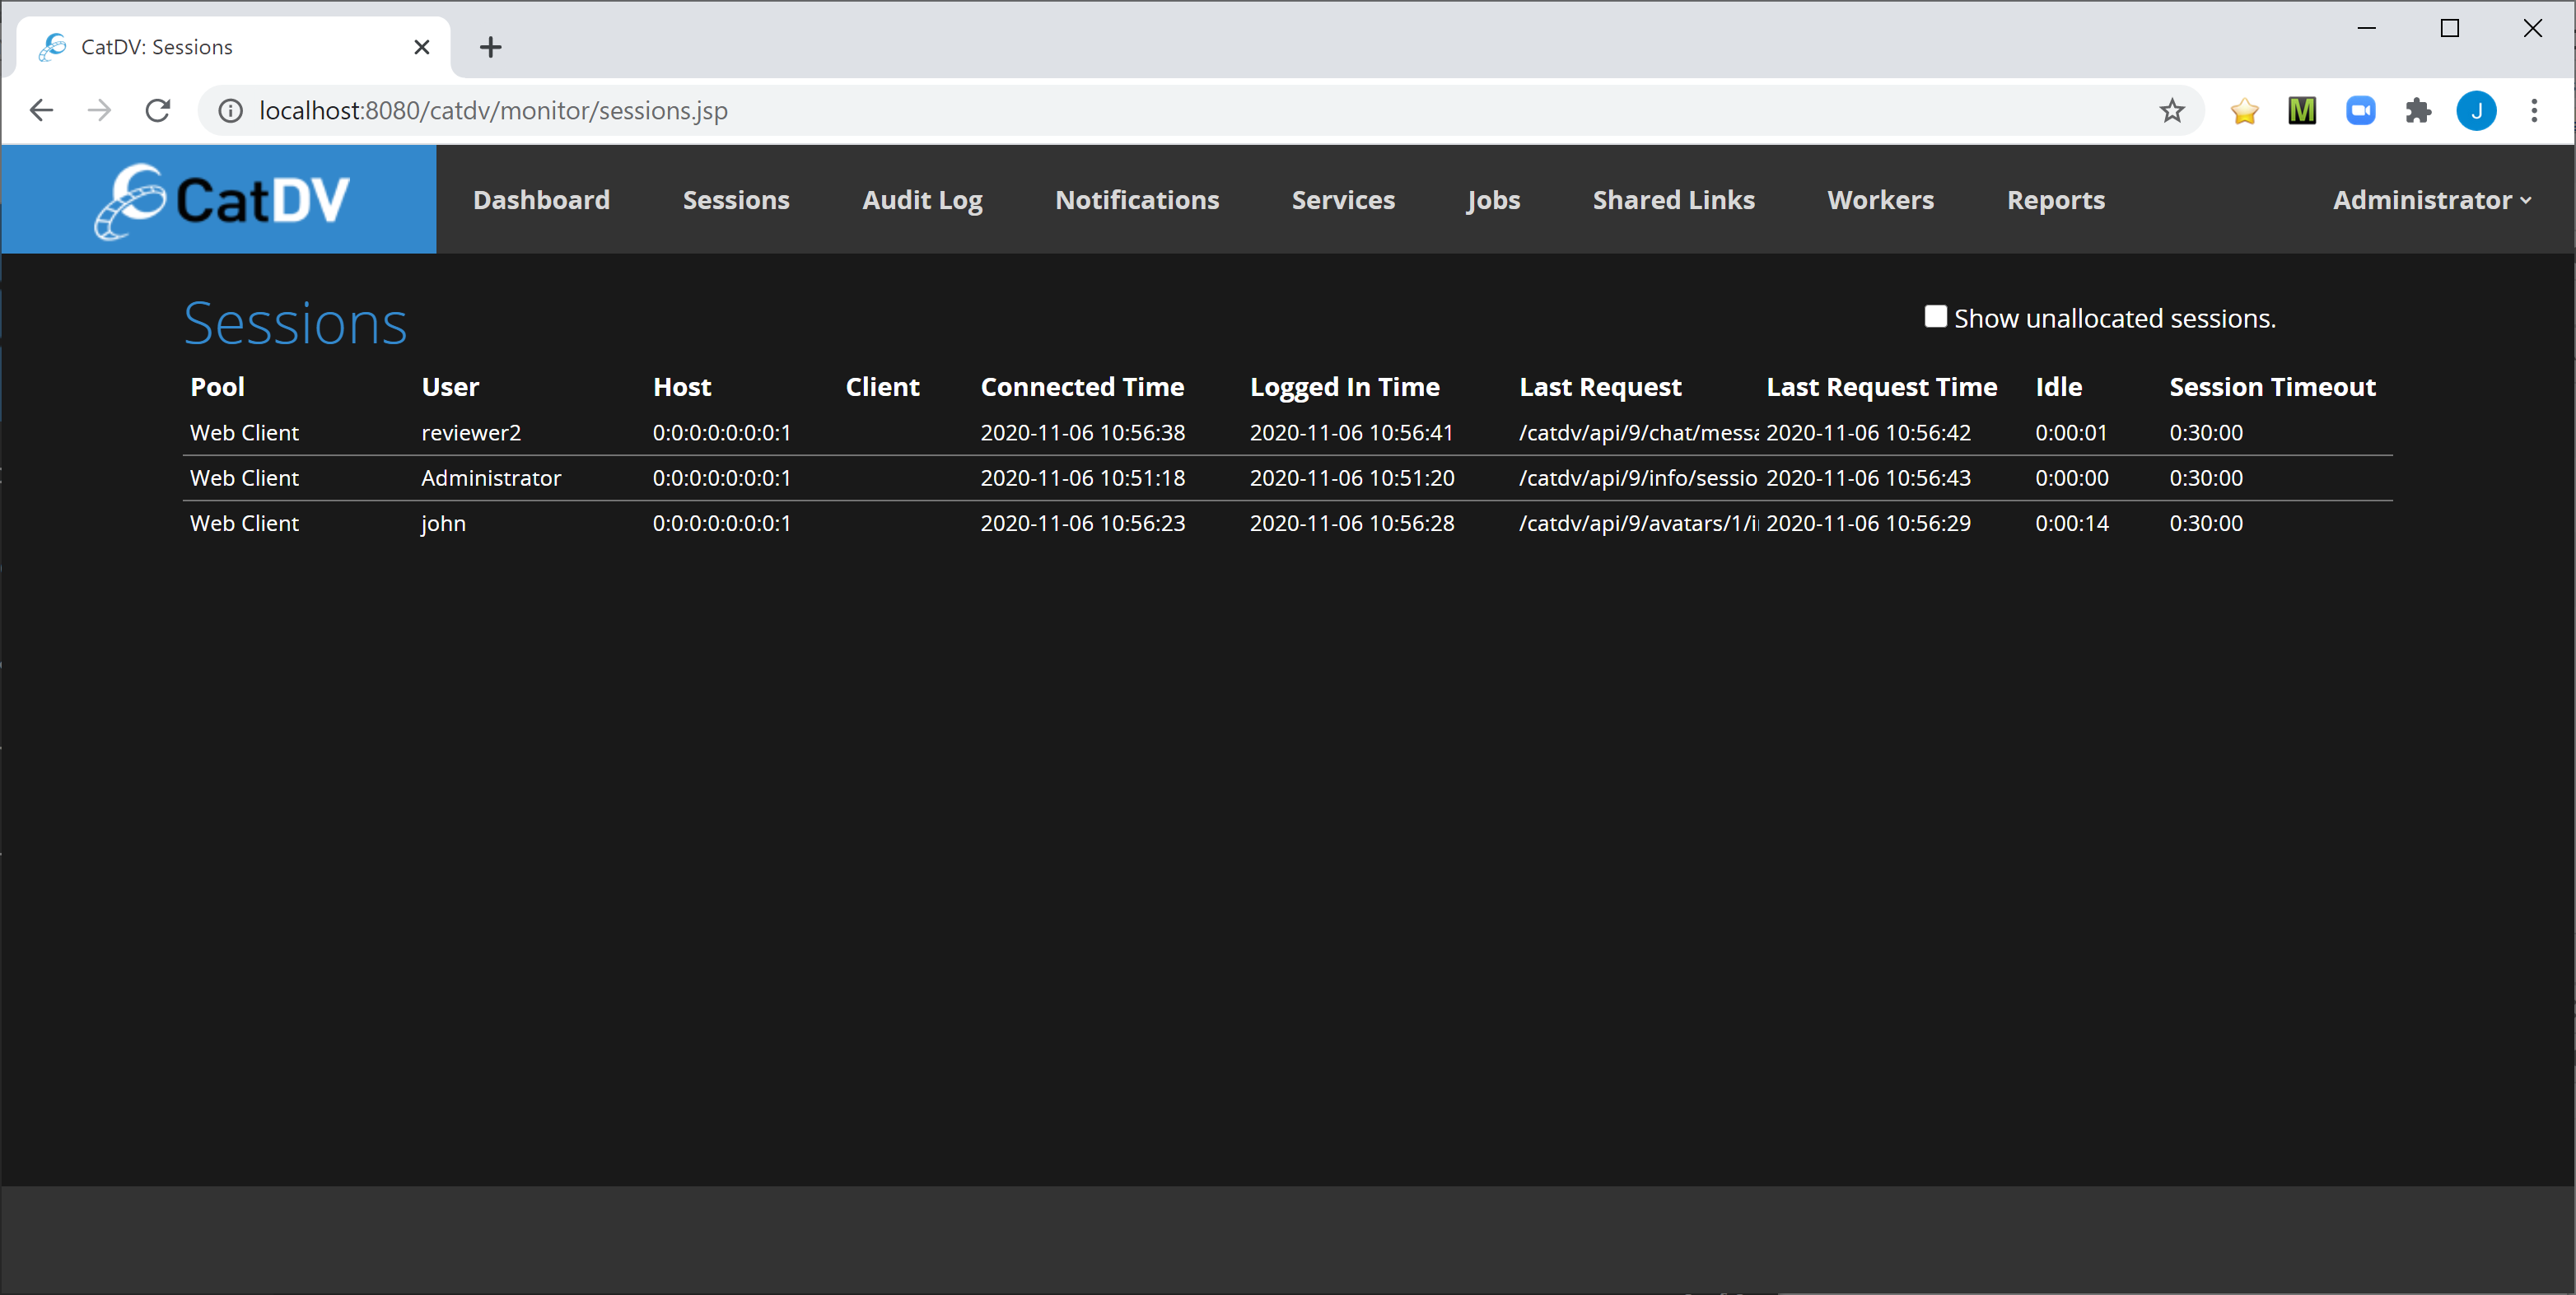
Sessions
The sessions section display a table of the currently active sessions. This includes logged in web users as well as REST API clients (integration).
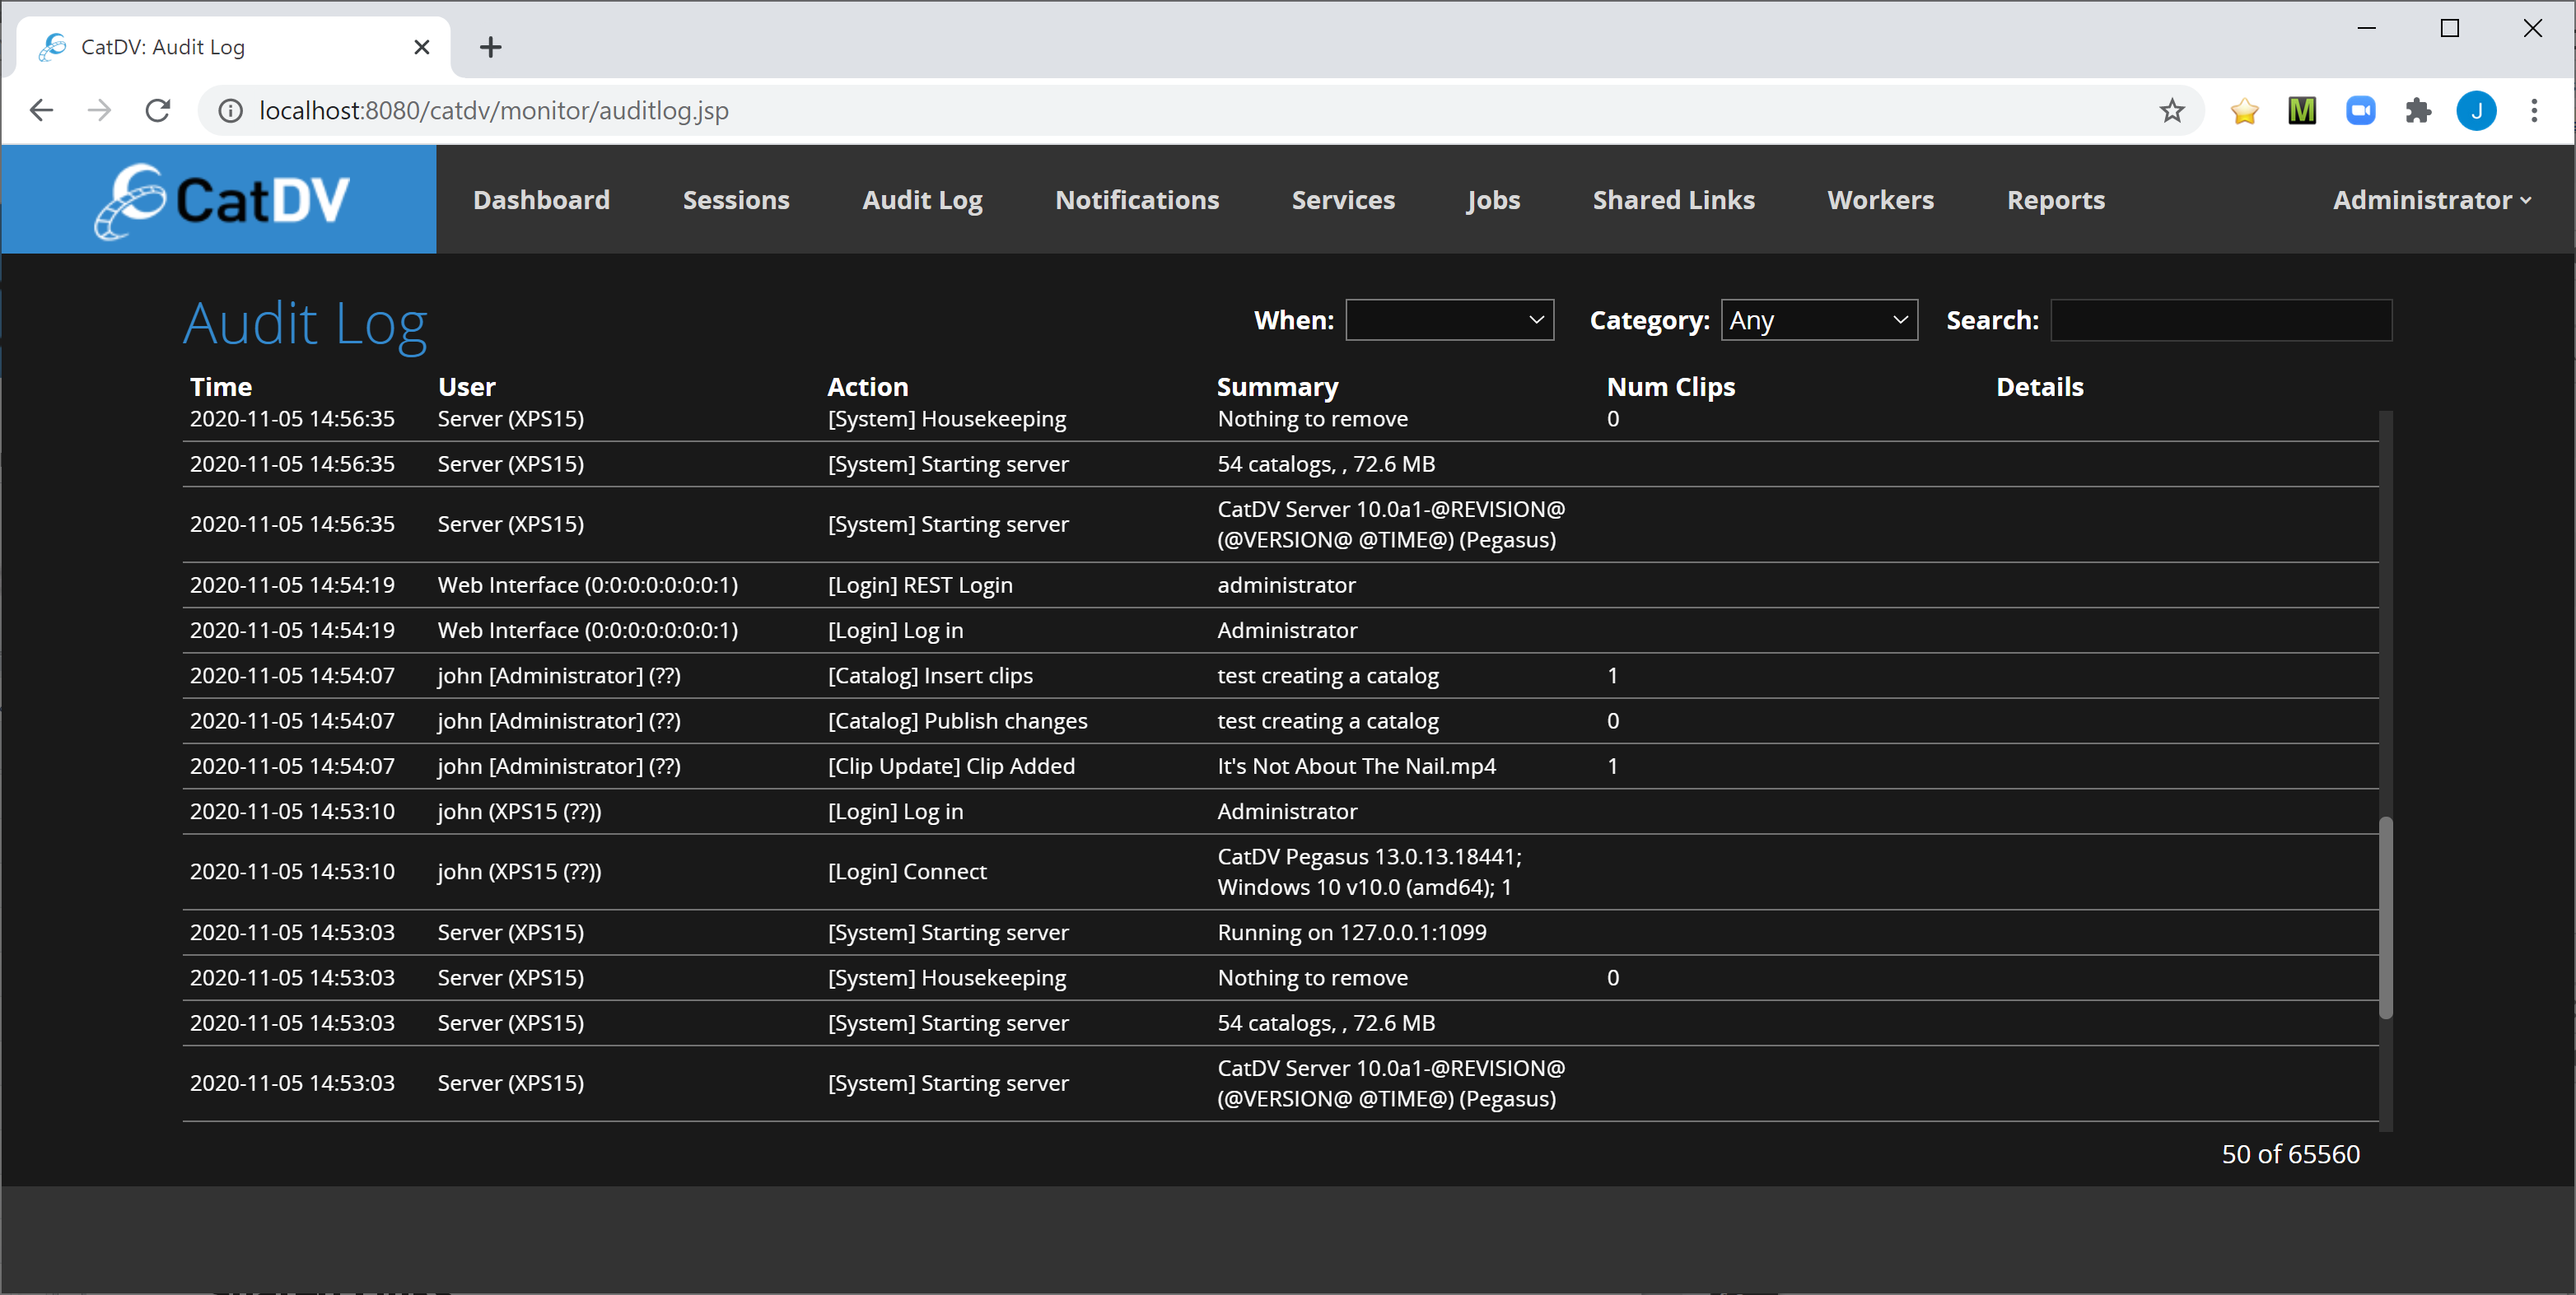
Audit Log
The Audit Log section displays the most recent entries from the system audit log and provides facilities for searching and filtering entries by time and type.
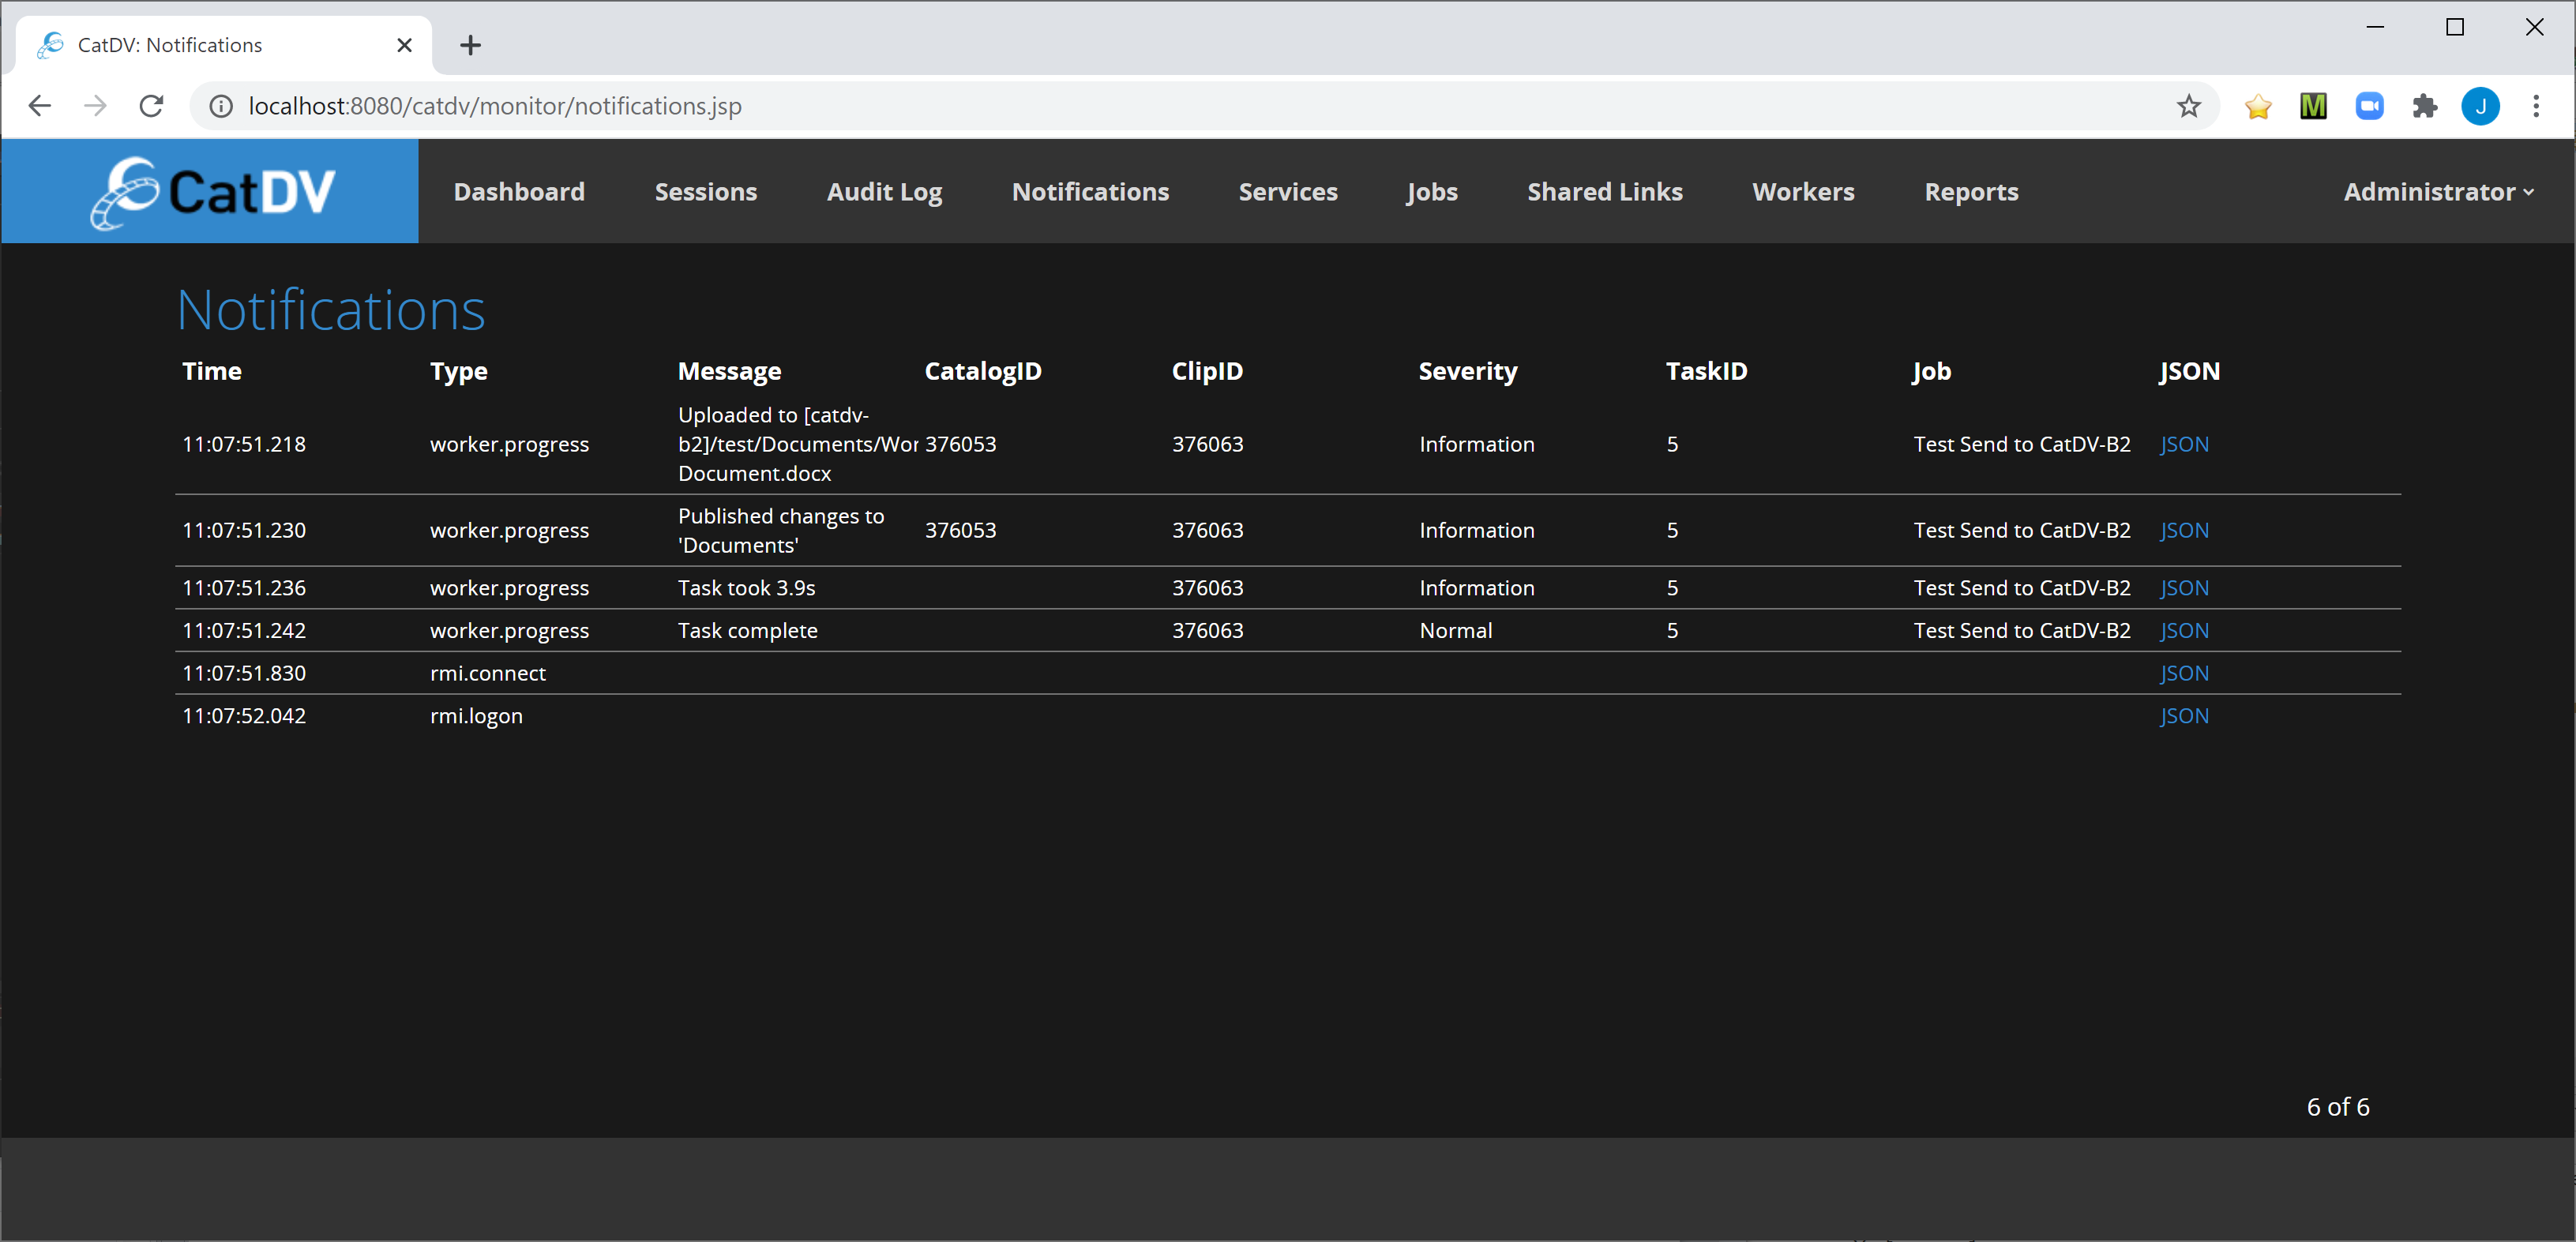
Notifications
The notifications page gives a snapshot of the notifications currently being generated by the system. This list is not persisted. It will always initially be empty, and will populate as notifications occur.
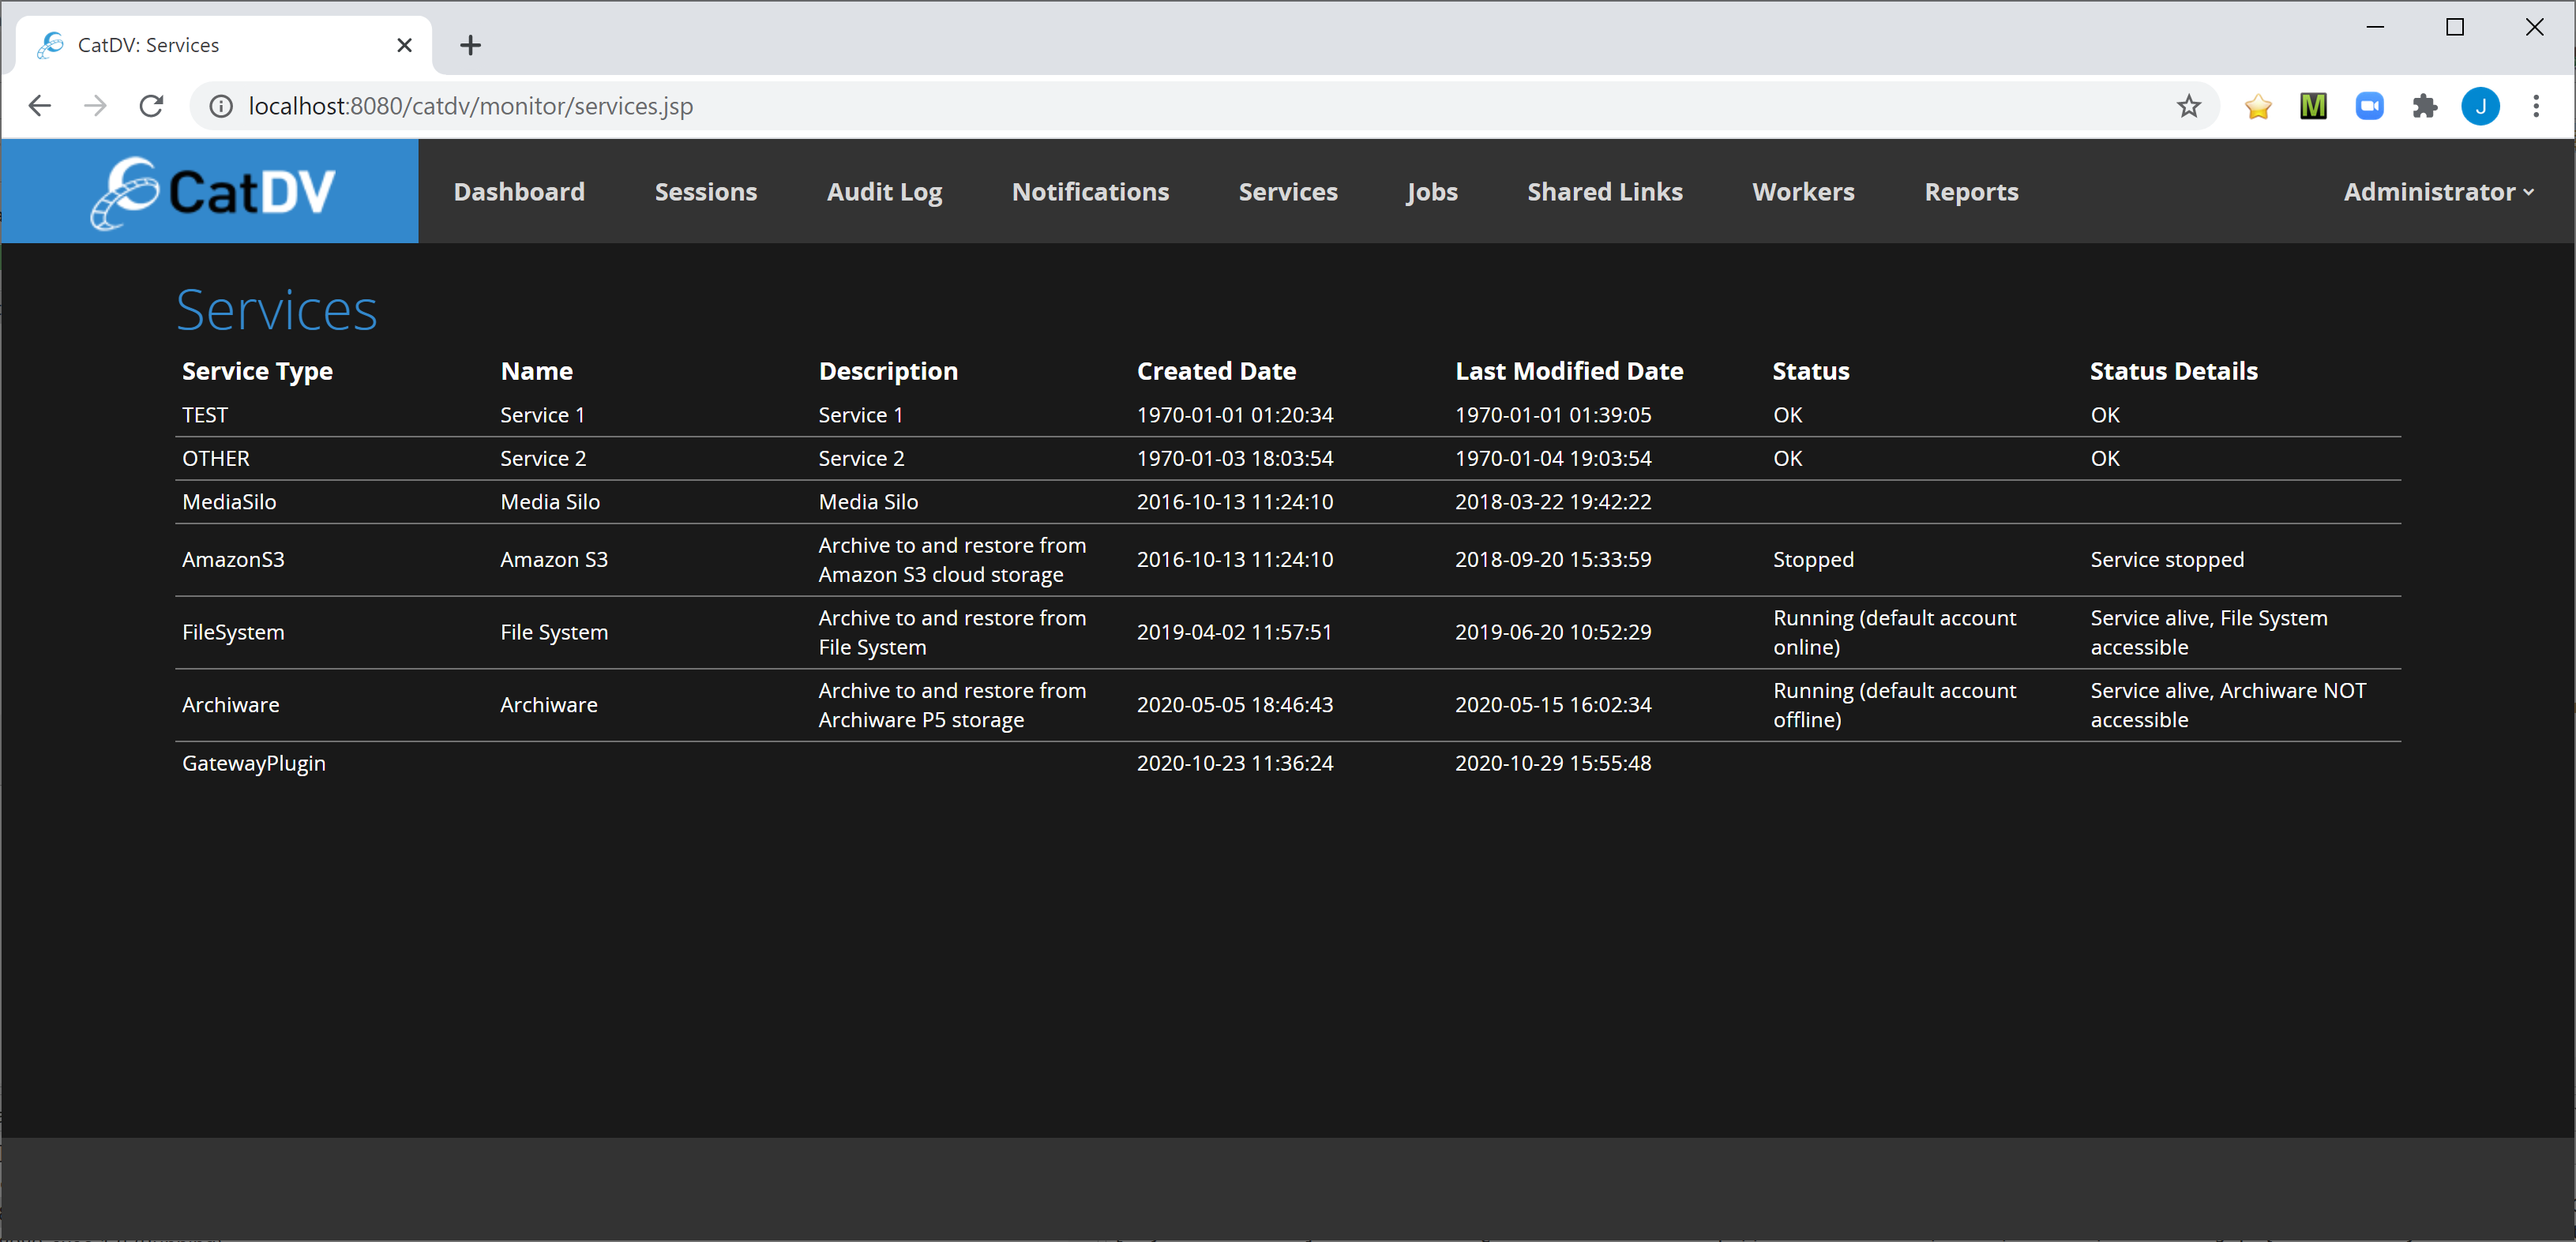
Services
The services section shows the registered background services installed on the server. Background services are currently primarily used for the CatDV Archiving plugins – such as the S3 and Archiware plugins.
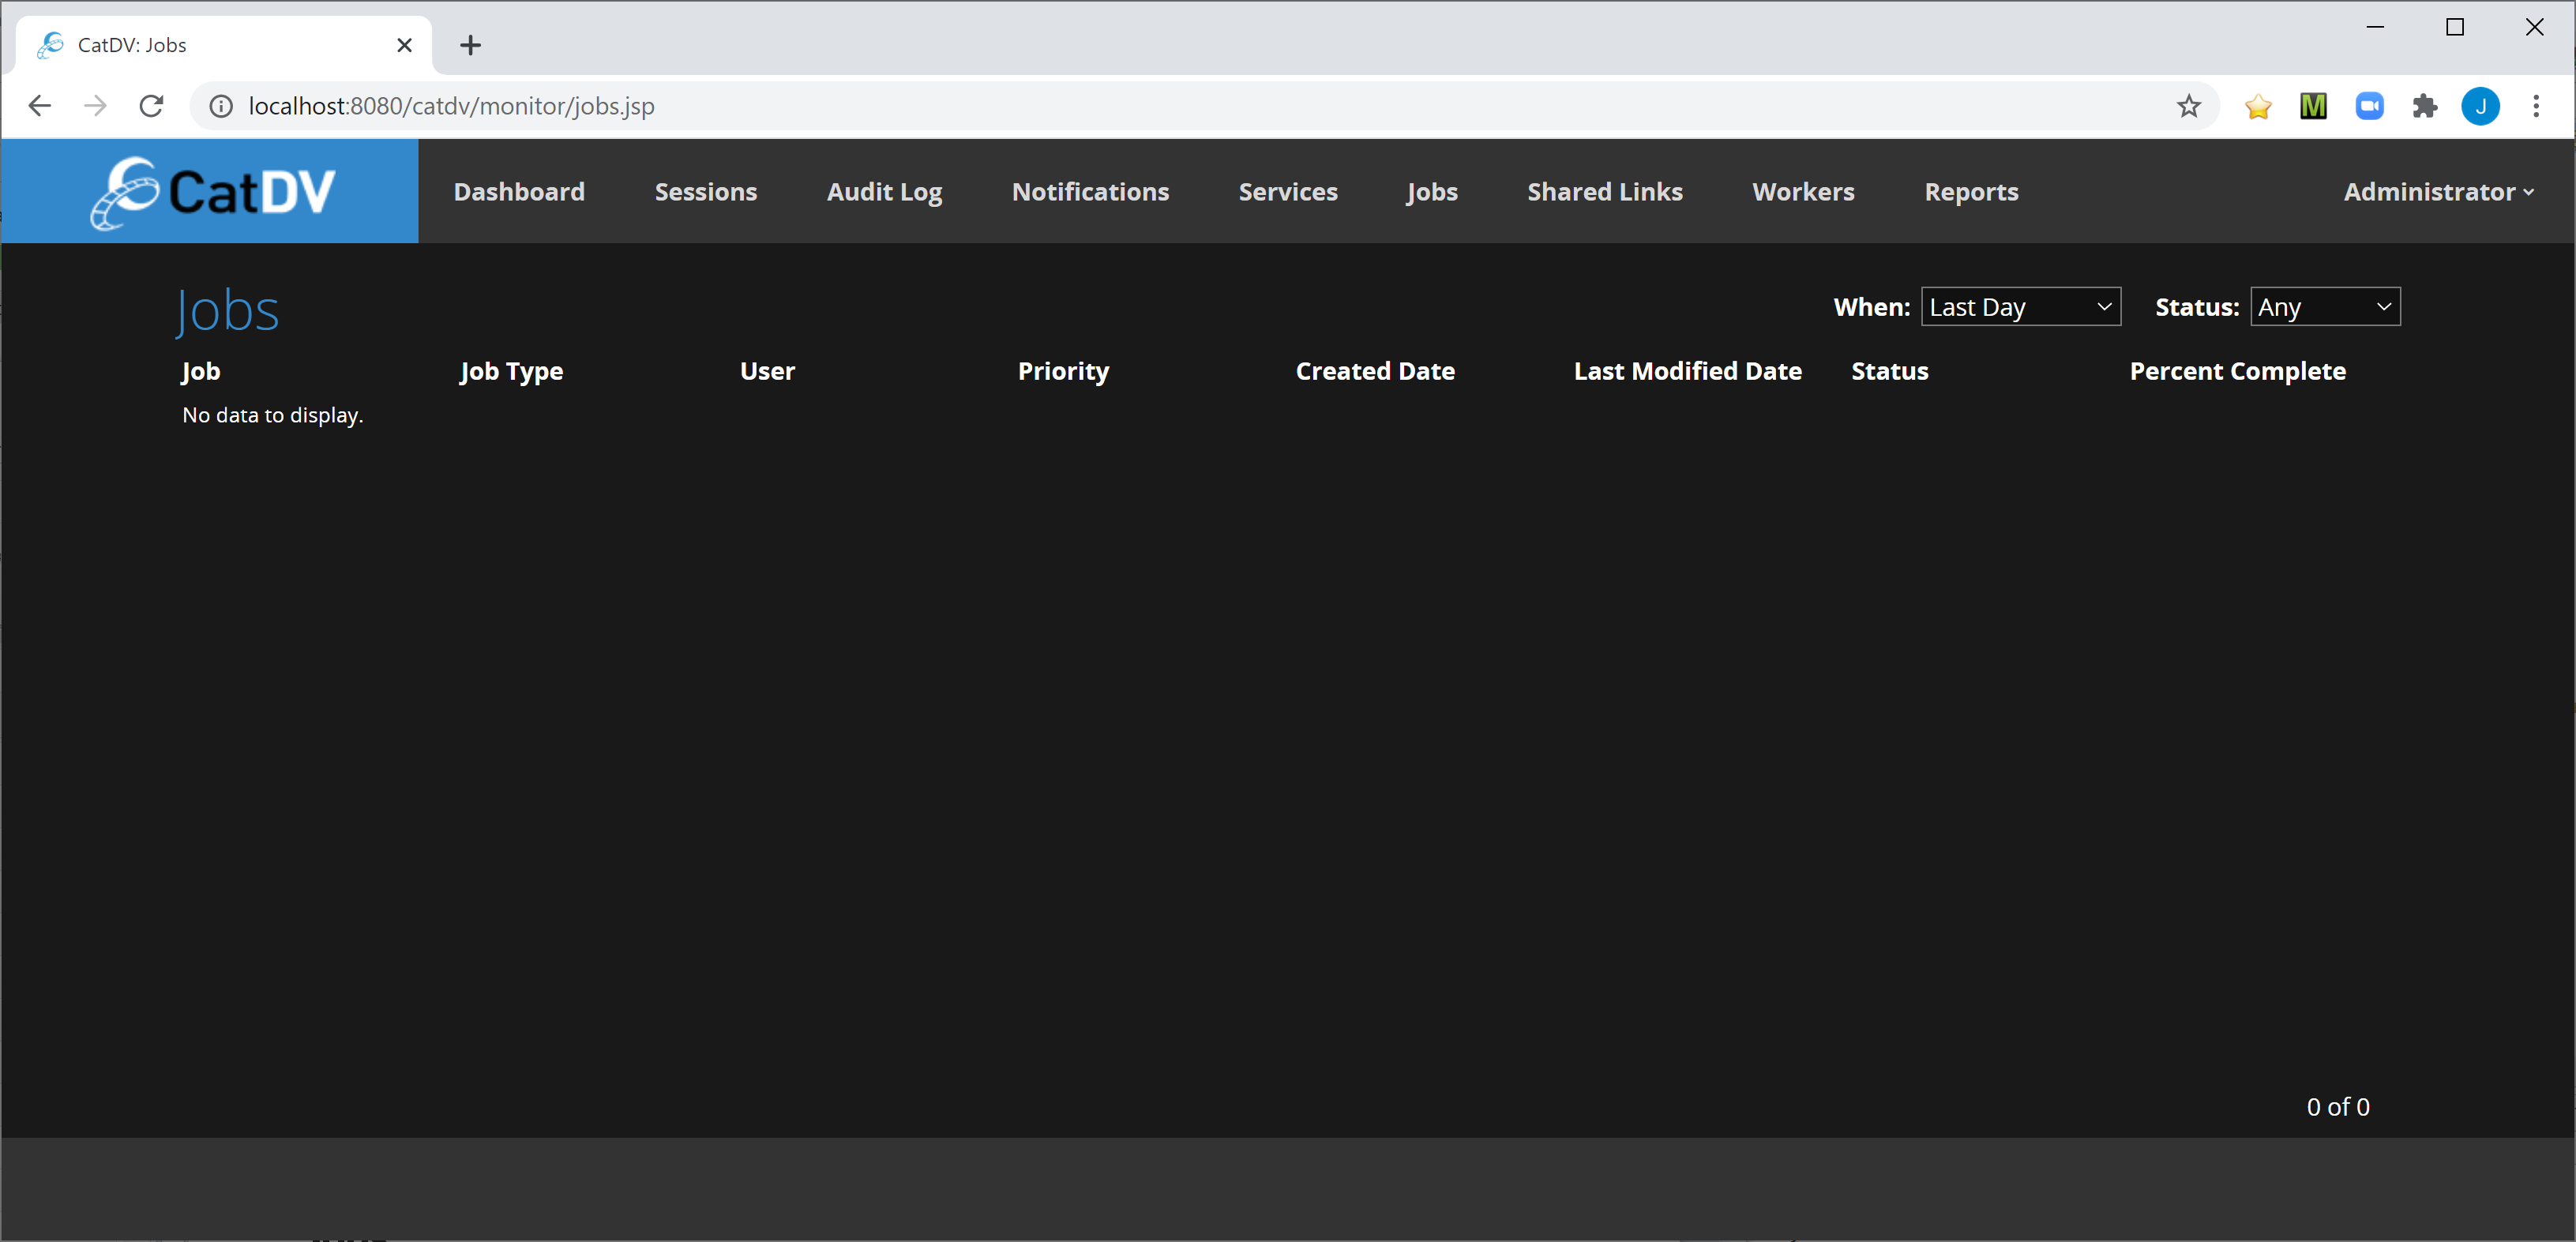
Jobs
The Jobs section displays active background service jobs, and provides facilities to filter them by time and status.
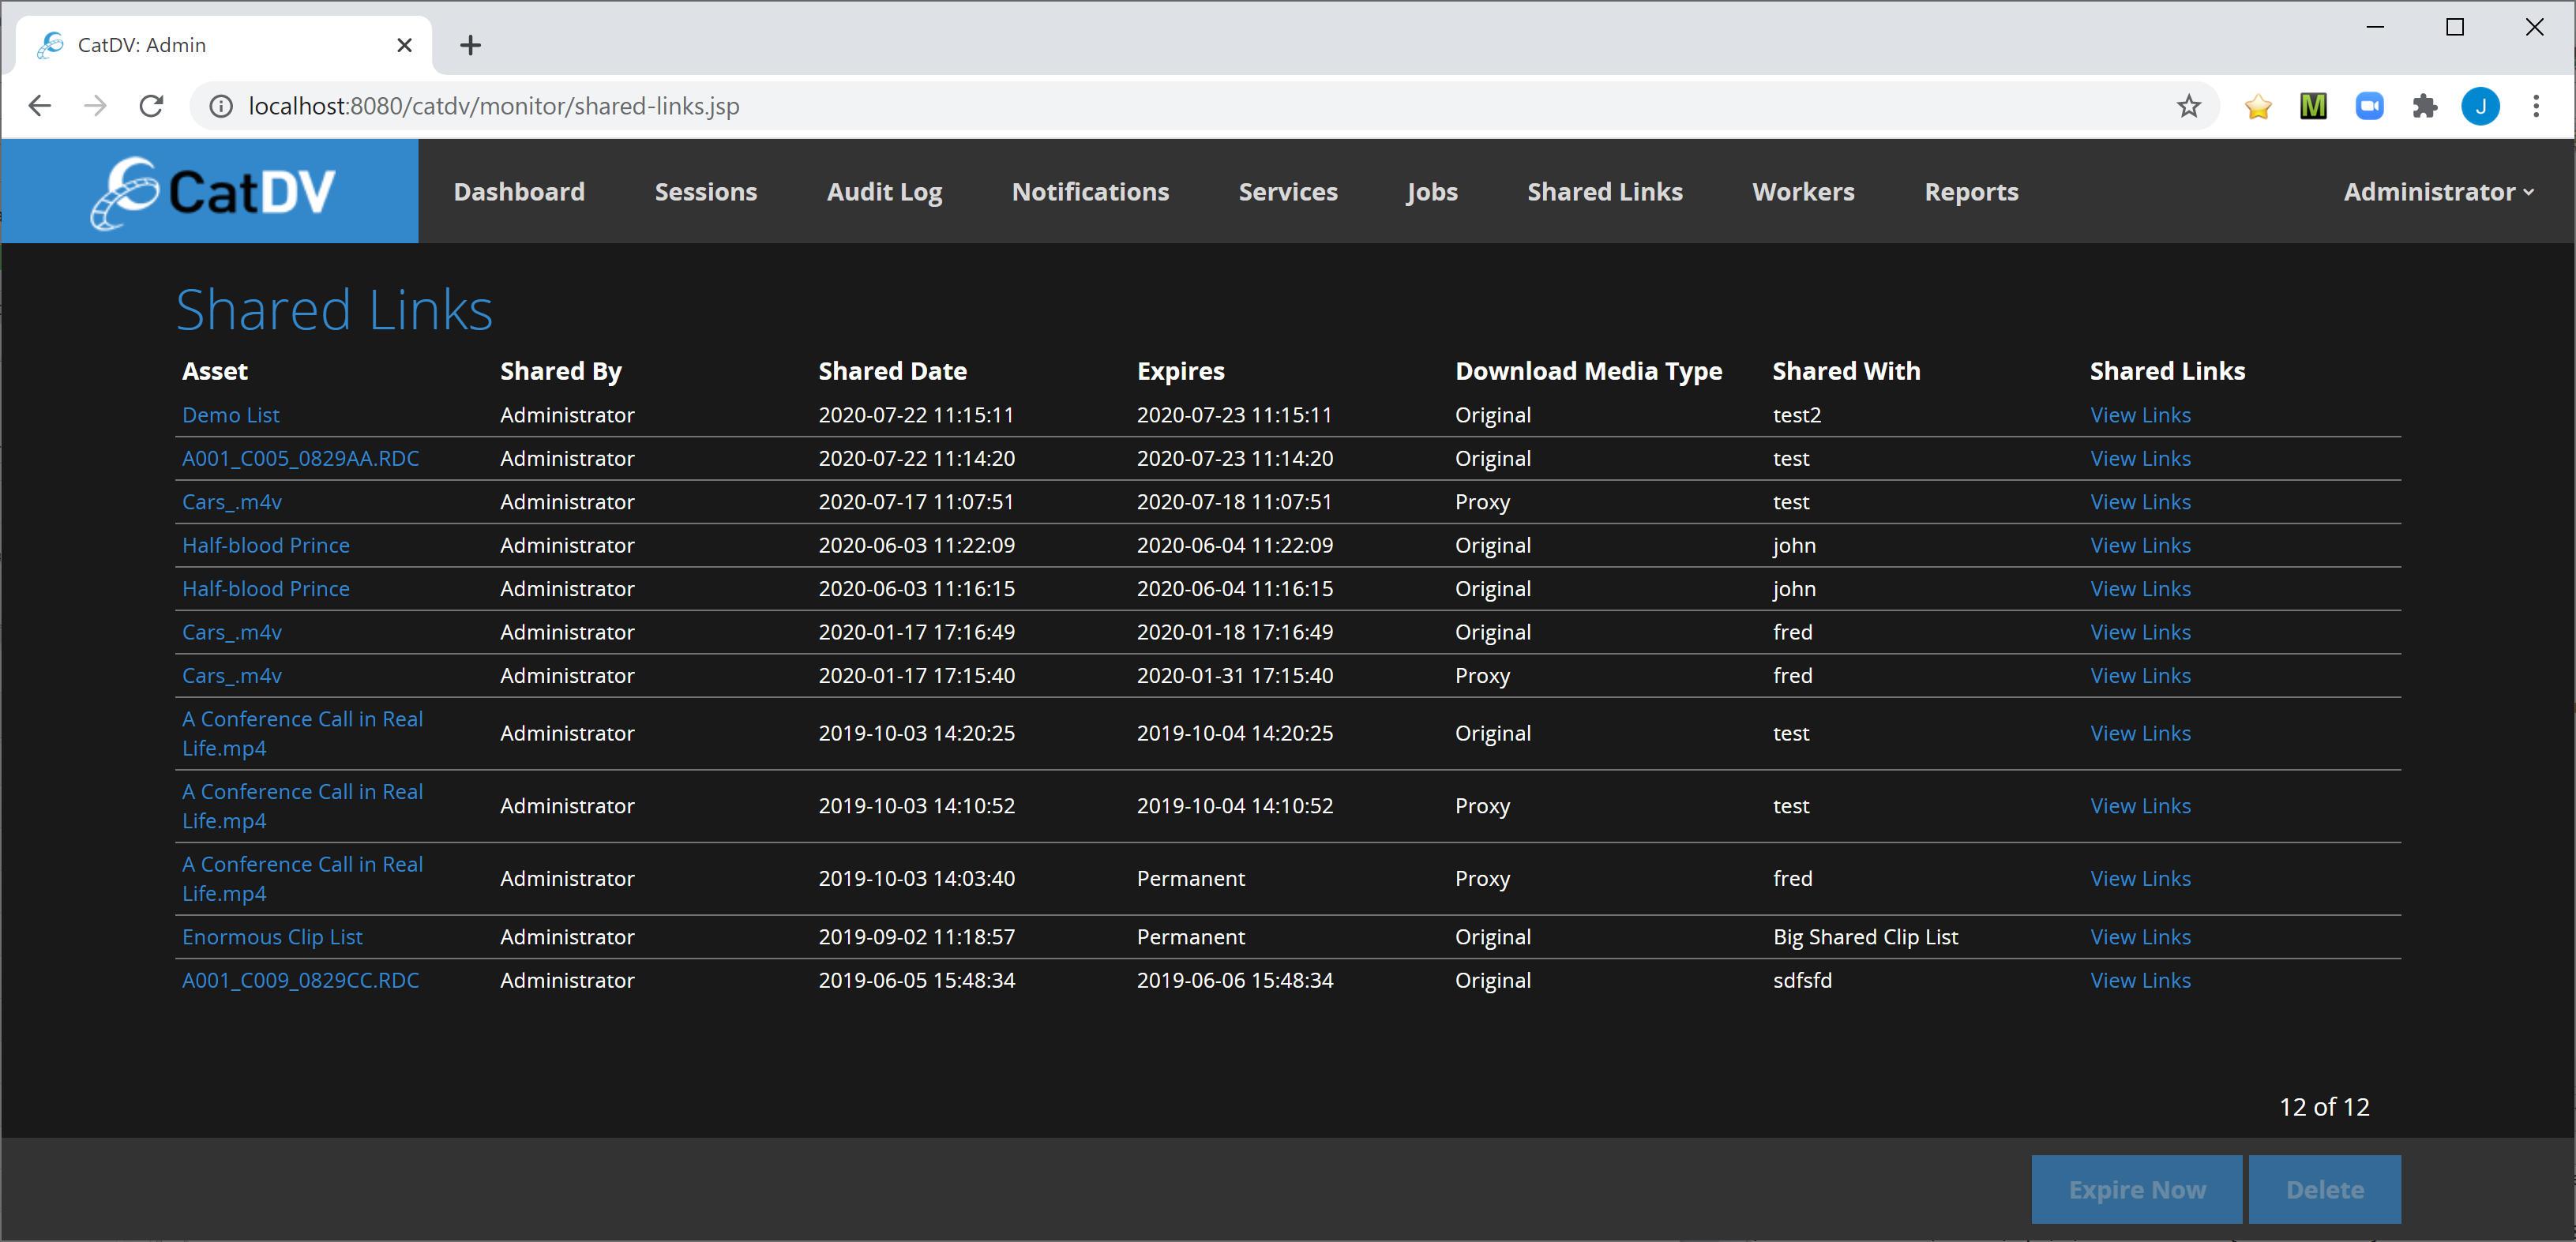
Shared Links
The shared links section allows an administrator to view all shared links across the whole system and see who shared what assets with whom. It also allows an administrator to expire or, if required, remove links.
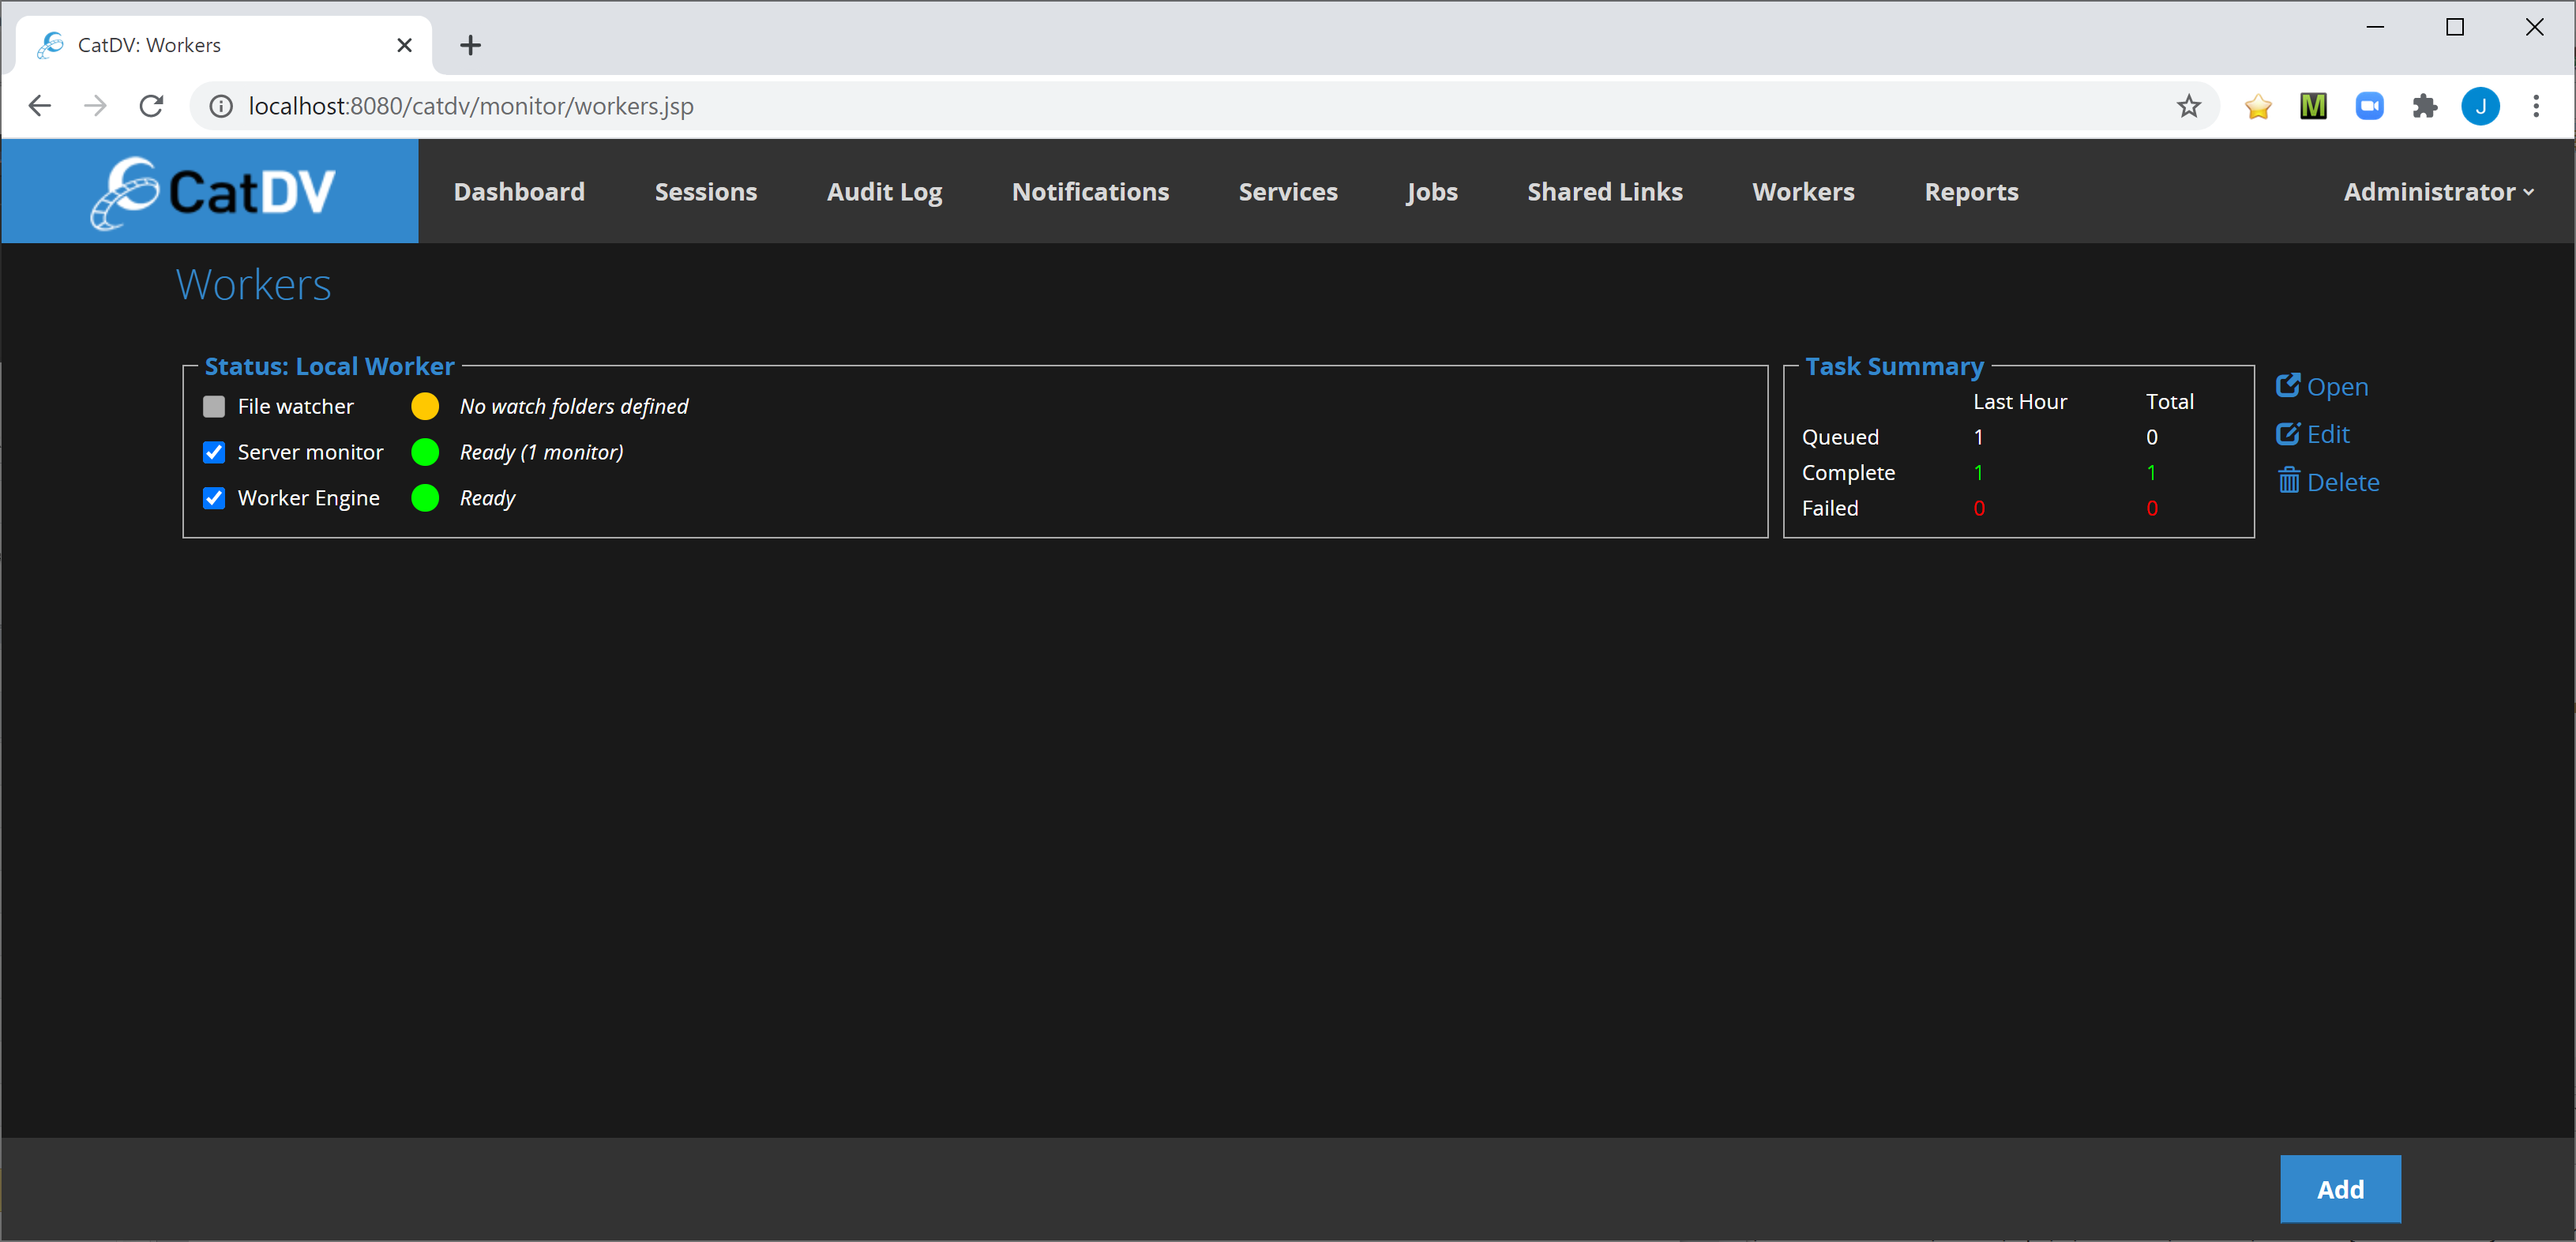
Workers
The Workers section allows an administrator to view the current status of all registered Pegasus Worker Nodes.
Registering Worker Nodes
Workers can be registered by clicking the Add button and entering a descriptive name plus the hostname and port of the worker node, and providing the REST API password.
Note: the Worker Node must be a Pegasus Worker Node and the “Enable REST API” checkbox must be ticked – as shown below.
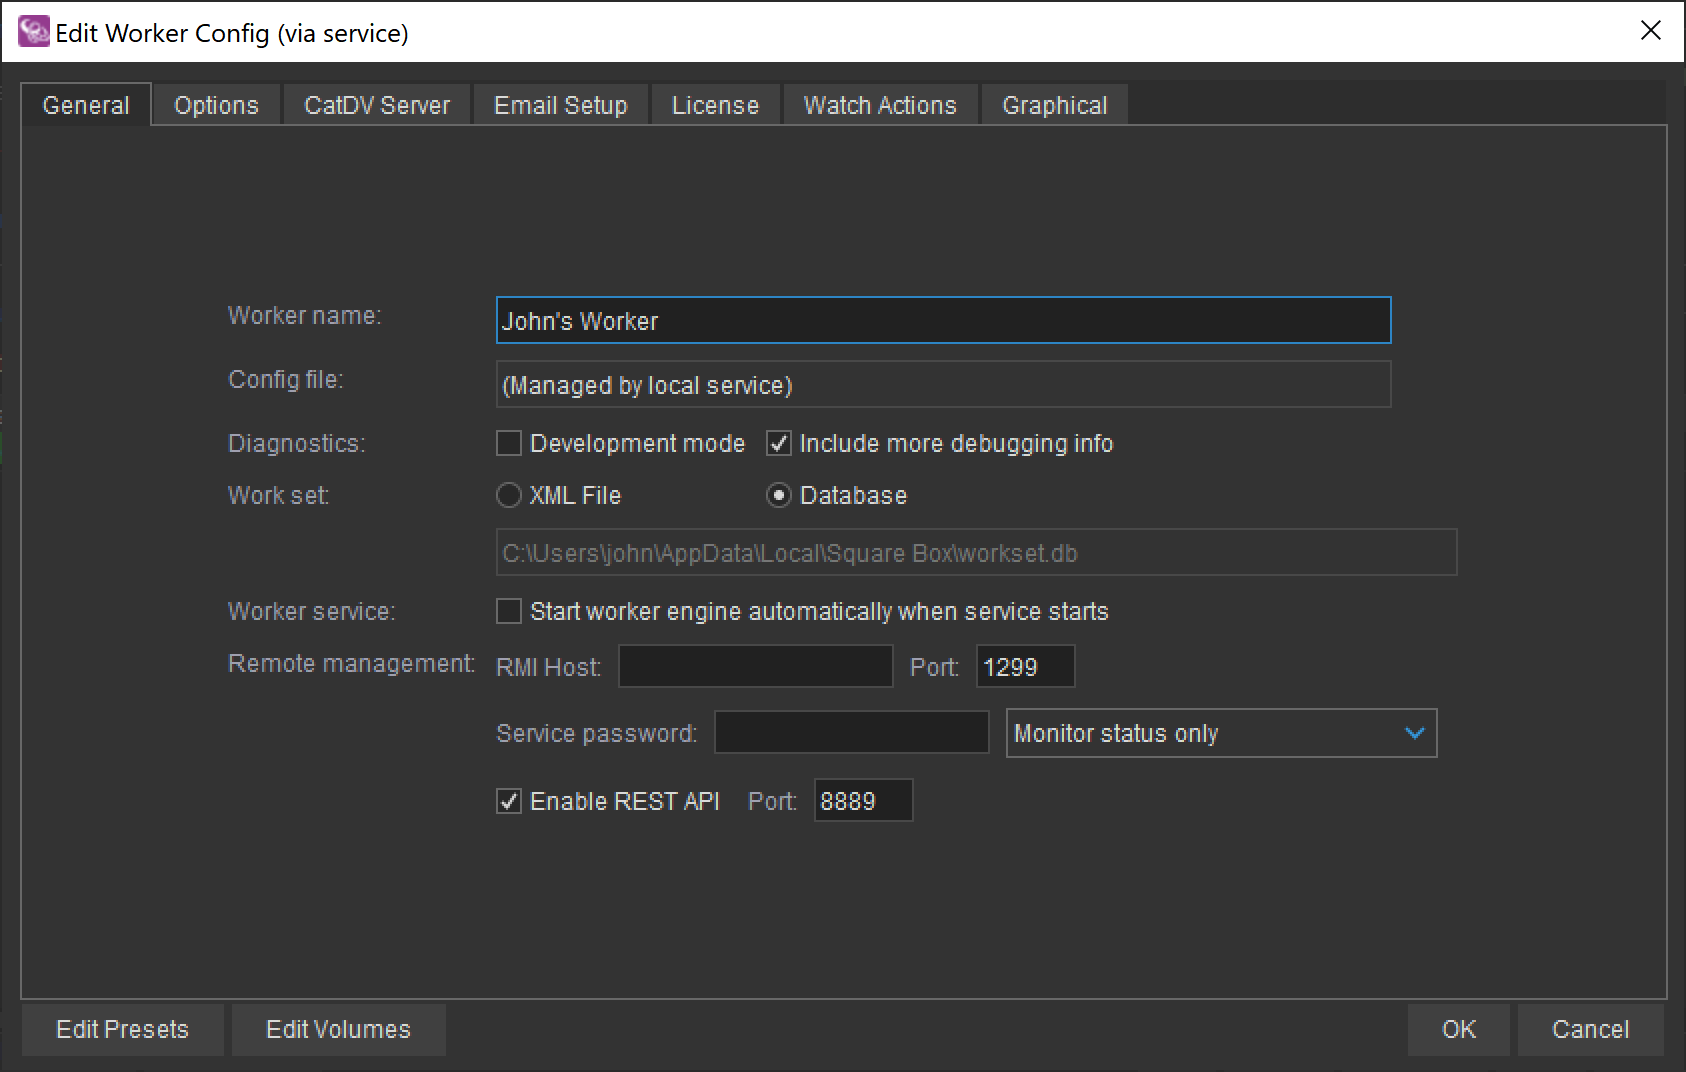
Also notice the Port number – shown to the right of the Enable REST API checkbox - is the port number that must be in entered into the Add Worker form above.
If a Service Password is set in the Worker Node – then this must also be entered into the Add Worker form.
Viewing Running Tasks
In addition to viewing the summary status of each registered worker – the currently running tasks can be viewed by clicking the ‘Open’ link to the right of the summary panel for that worker node.
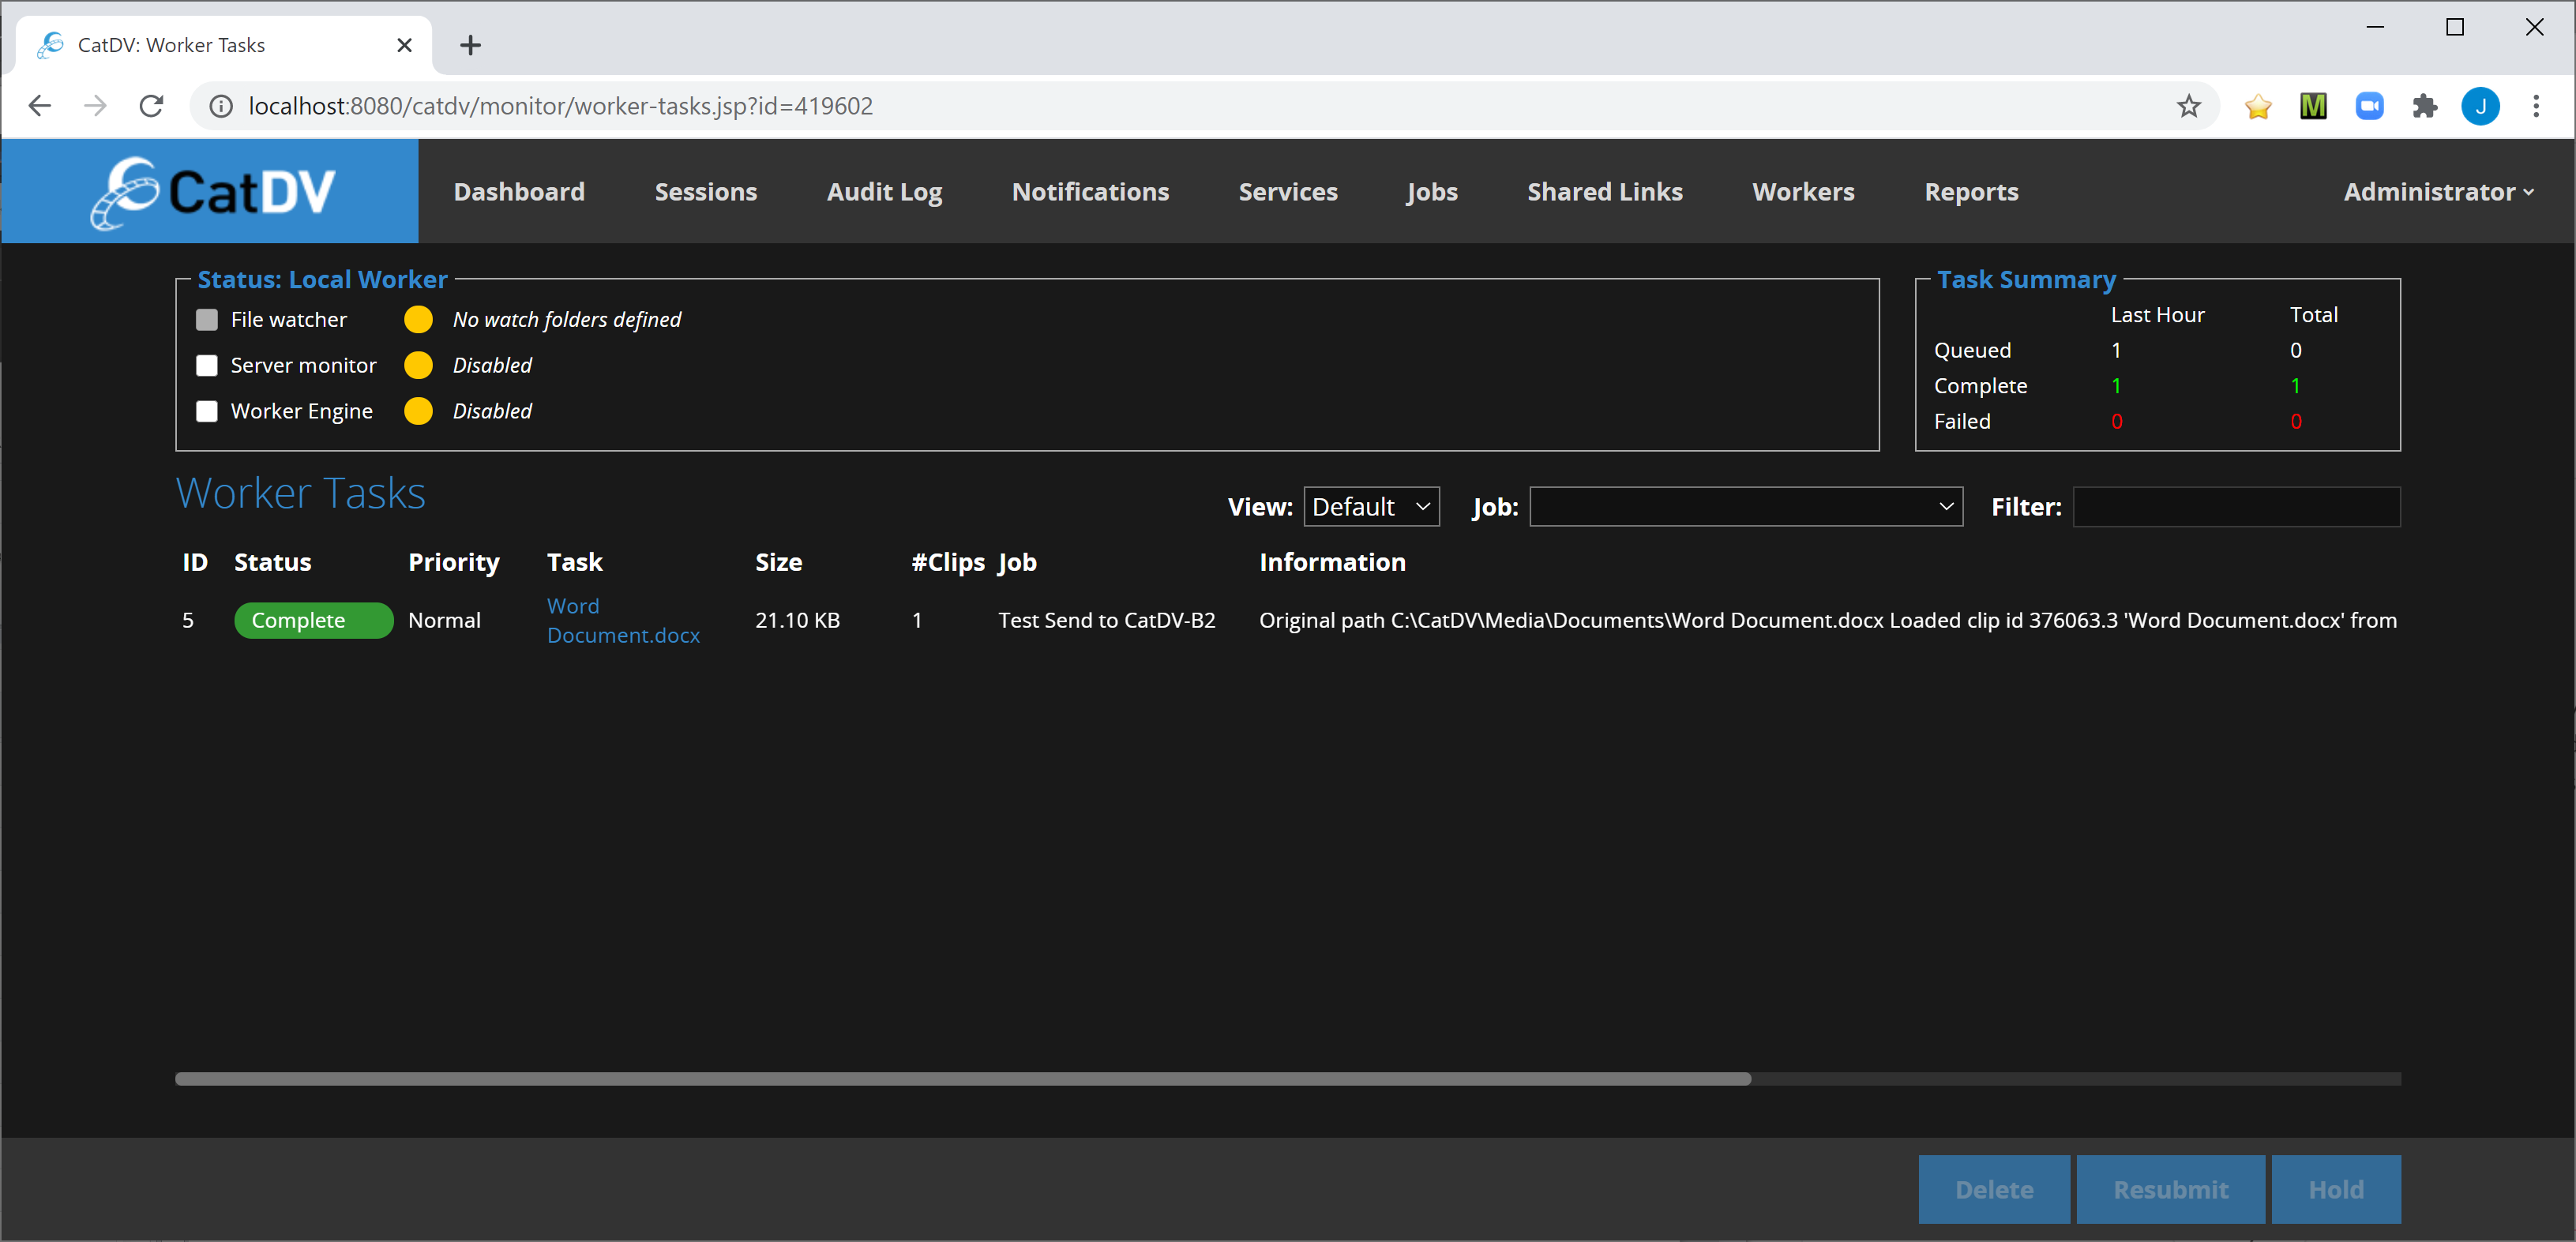
Note: The ‘Open’ button is a hyperlink – so right-clicking on it in most browsers will offer the option to open the task list in a new window or tab – which can be useful if many workers are being monitored.
Reports
Pegasus Server provides a very simple built-in reporting tool, that allows the results of SQL queries to be tabulated, displayed and exported via the clip board. This reporting tool is not intended to compete with full-featured reporting tools such as BIRT, but it is still a useful tool for creating simple reports.
Creating a Report
A new report can be created by clicking the ‘Add’ button.
Enter a name and optionally a description and then enter the SQL Query that generates the report data. The above example displays the catalogs in the system and the size of media assets in each one.
Note the use the SQL ‘AS’ operator to display friendly column names in the report output (e.g. c_group.name AS ‘Group Name’).
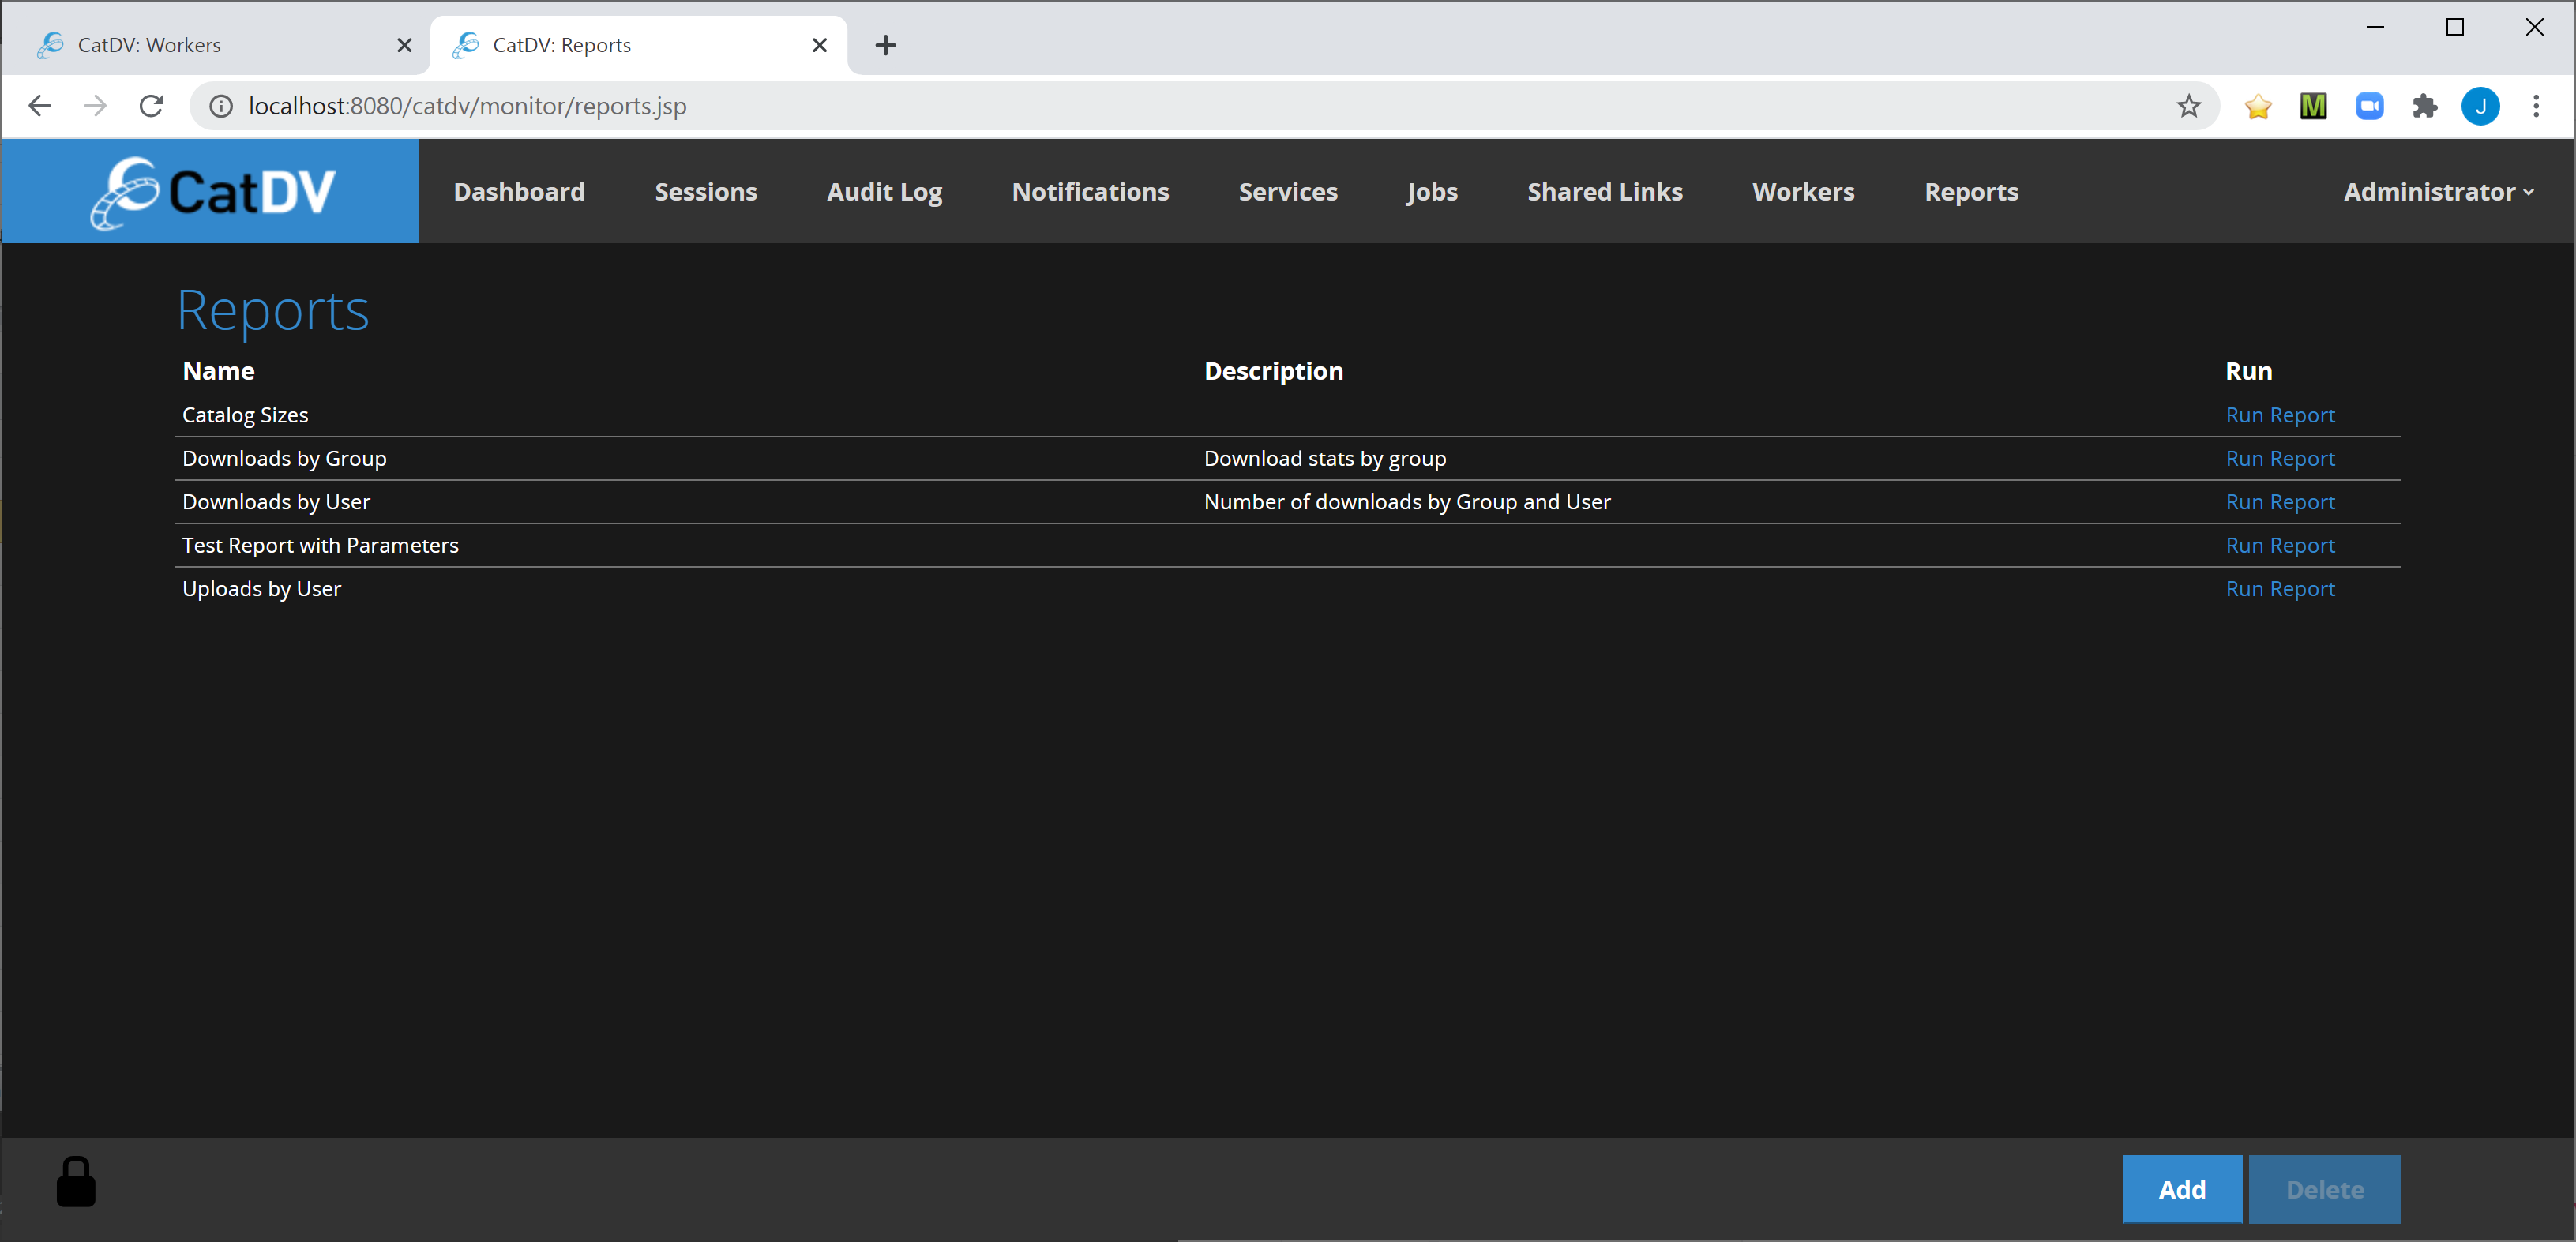
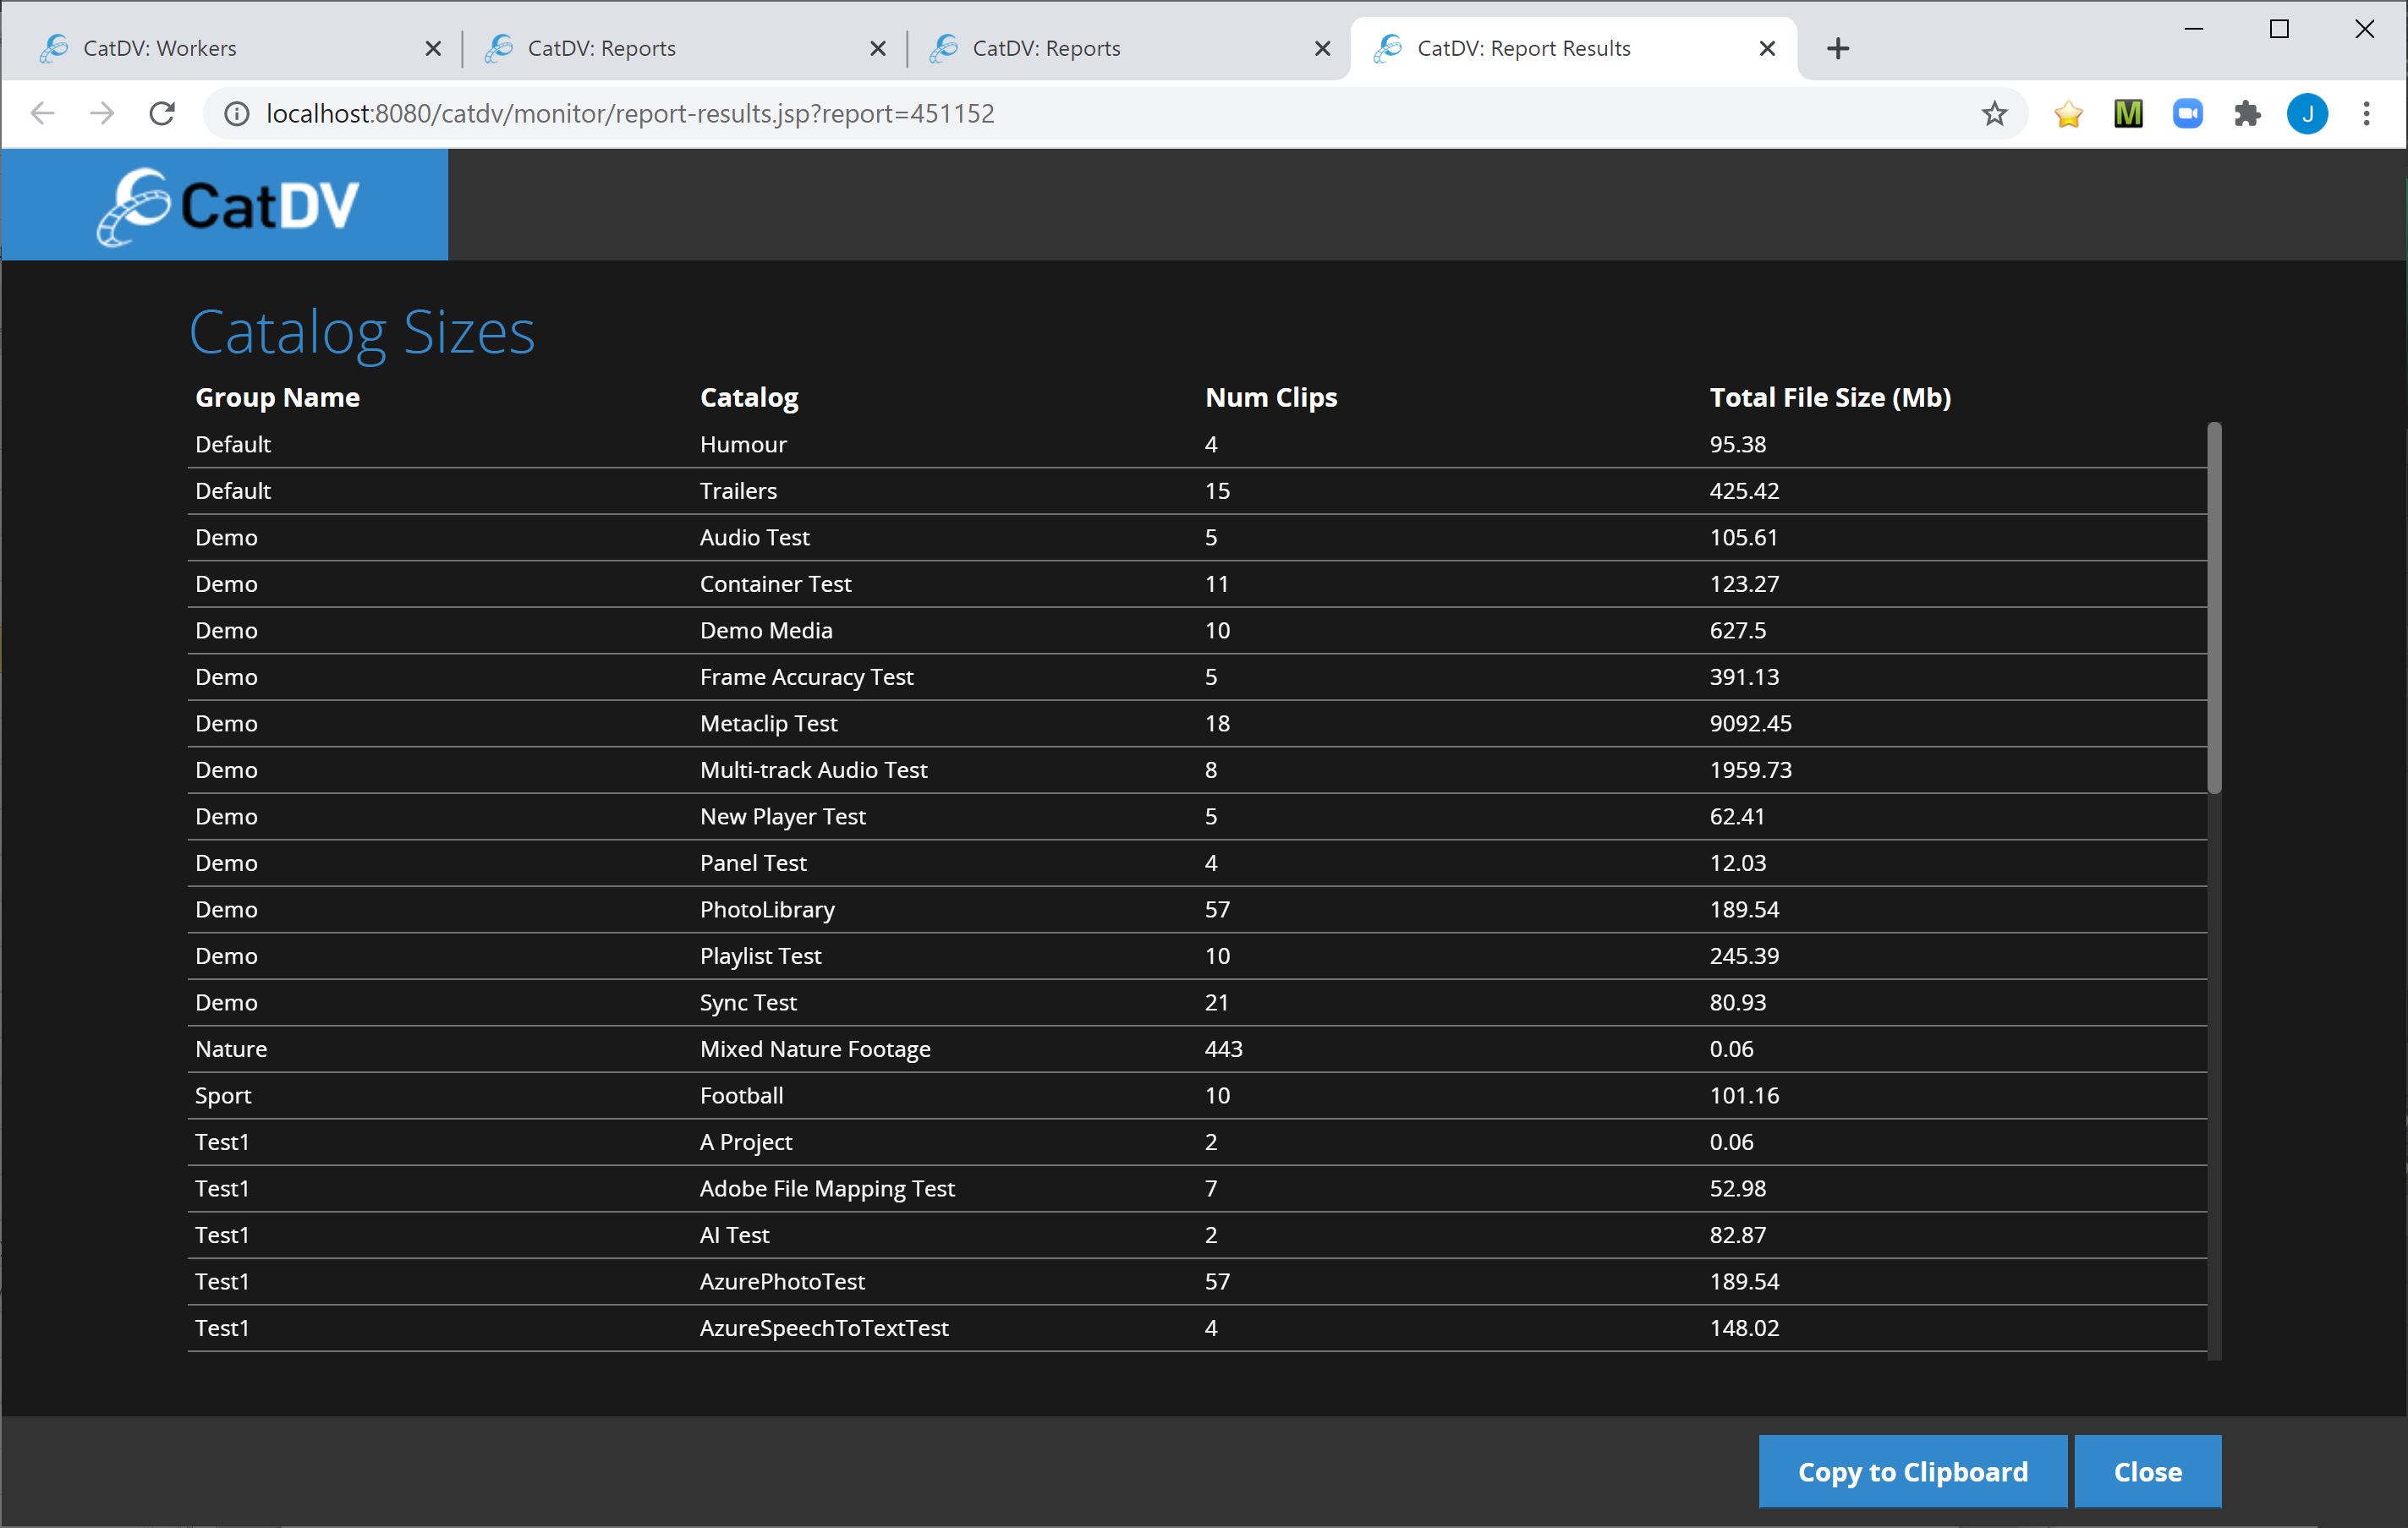
Running a Report
Run a report by clicking the ‘Run Report’ link alongside the relevant report. Below is the output from the example Catalog Sizes report.
Editing a Report
Normally the SQL for each report is hidden. To edit a report first click the padlock icon at the bottom left of the page, which will convert the report name column into hyperlinks, that when clicked will open the report’s SQL editor.
Report Parameters
It is possible to add simple parameters to reports as shown below:
The above report has two parameters:
1. groupID
2. minCreatedDate
The values of these parameters are substituted into the SQL using the ${<parameter_identifier>} syntax i.e. ${groupID} and ${ minCreatedDate}.
Running the Report
When a report with parameters is run a form is displayed to allow the values of the parameters to be entered:
Note: the fields are always marked as mandatory – and must be completed before the report can be run.
Defining Report Parameters
These parameters are defined using JSON in the ‘Parameters’ tab:
The parameter definition is a JSON array containing, in this case, two JSON parameter objects. These objects have the following parameters:
· name – display name of the parameter used in the parameter form.
· identifier – uniquely identifies the parameter - used in the ${<parameter_identifier>} tags.
· type – the type of the parameter. See the CatDVREST API documentation for a full list of supported field definition types.
· values – for picklists – an array of string values to select from.
· datasource – alternatively it is possible to use a simple REST API database to populate a ‘picklist’ field. The ‘path’ is the REST API endpoint, and the ‘value’ and ‘text’ properties select the fields from the result set that are used to populate the picklist.